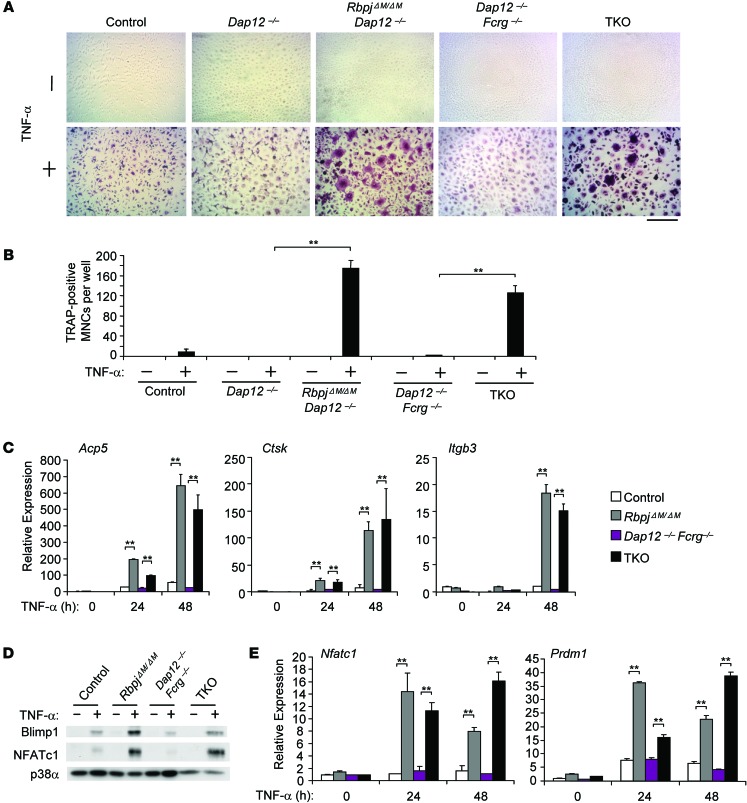
Figure 7. RBP-J deficiency allows TNF-α to induce osteoclast differentiation in Dap12–/– and Dap12–/–Fcrg–/– BMMs.
BMMs derived from control, Dap12–/–, RbpjΔM/ΔMDap12–/–, Dap12–/–Fcrg–/–, and TKO mice were stimulated with TNF-α for 5 days. TRAP staining was performed (A), and the number of TRAP-positive MNCs (≥ 3 nuclei per cell) per well was counted (B). TRAP-positive cells appear red in the photographs. Scale bar: 100 μm. Data are representative of at least 20 independent experiments. **P < 0.01. (C) Quantitative real-time PCR analysis of mRNA expression of Acp5 (encoding TRAP), Ctsk (encoding cathepsin K), and Itgb3 (encoding β3) in BMMs from control, RbpjΔM/ΔM, Dap12–/–Fcrg–/–, and TKO mice treated with TNF-α for the indicated times. Data are representative of at least 3 independent experiments. **P < 0.01. (D) Immunoblot analysis of NFATc1 and BLIMP1 expression in whole-cell lysates obtained from control, RbpjΔM/ΔM, Dap12–/–Fcrg–/–, and TKO BMMs after stimulation with TNF-α for 24 hours. p38α was measured as a loading control. Data are representative of at least 3 independent experiments. (E) Quantitative real-time PCR analysis of mRNA expression of Nfatc1 (encoding NFATc1) and Prdm1 (encoding Blimp1) induced by TNF-α in osteoclastogenic cell cultures from control, RbpjΔM/ΔM, Dap12–/–Fcrg–/–, and TKO BMMs. Data are representative of at least 3 independent experiments. **P < 0.01.

