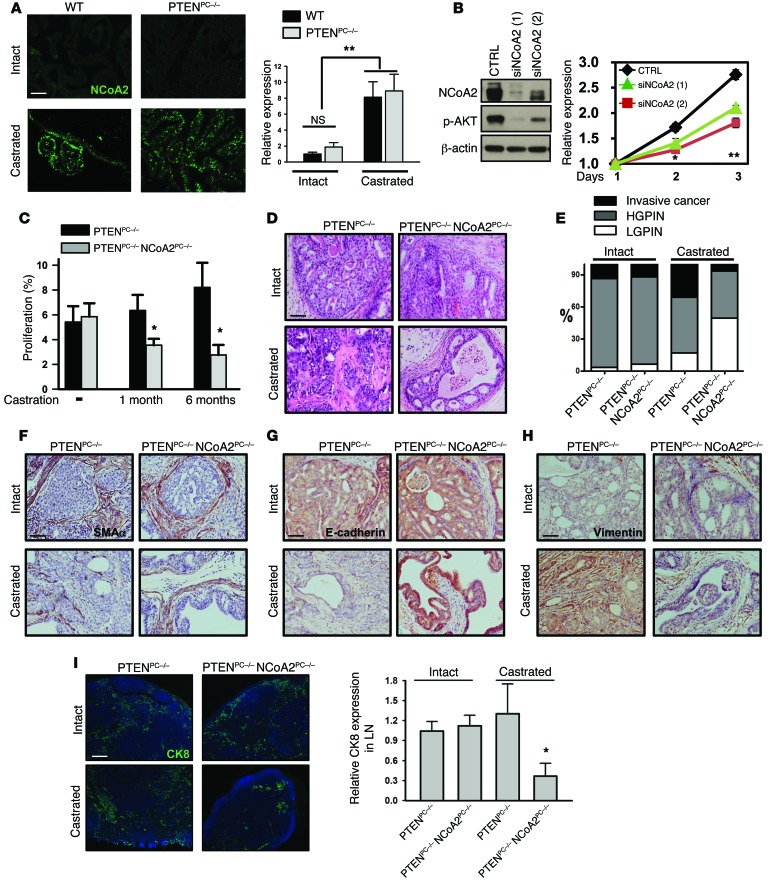
Figure 3. Upregulation of NCoA2 during androgen deprivation is critical in metastatic CPRC.
(A) Immunostaining (left) and qRT-PCR (right) analysis of NCoA2 expression in wild-type and PTEN-null prostate with or without castration. n = 10. (B) MTT analysis of cell growth in CTRL and NCoA2-depleted LNCaP-Abl cells cultured in charcoal-stripped media. n = 3. (C) Quantitative results of Ki67-positive staining in prostate tumors from PTENPC–/– and PTENPC–/– NCoA2PC–/– mice after 1 or 6 months of castration. n = 6. (D–H) H&E staining (D); IHC analyses of α-SMA (F), E-cadherin (G), and vimentin (H) expression; and quantitative results (E) of prostate tumor progression in prostate tumors from PTENPC–/– and PTENPC–/– NCoA2PC–/– mice with or without castration (mice were castrated at 4 months of age, and the samples were isolated after 6 months of castration). P < 0.001 (invasive tumor and LGPIN), P = 0.3218 (HGPIN), castrated PTENPC–/– vs. castrated PTENPC–/– NCoA2PC–/–, Fisher’s exact test. (I) Lymph node metastasis of prostate tumors in PTENPC–/– and PTENPC–/– NCoA2PC–/– mice with or without castration are shown as above. qRT-PCR analysis of Ck8 expression in lymph node was used to quantify metastasis. n = 8. Scale bars: 100 μm (A and I), 50 μm (D, F–H). *P < 0.05; **P < 0.01.

