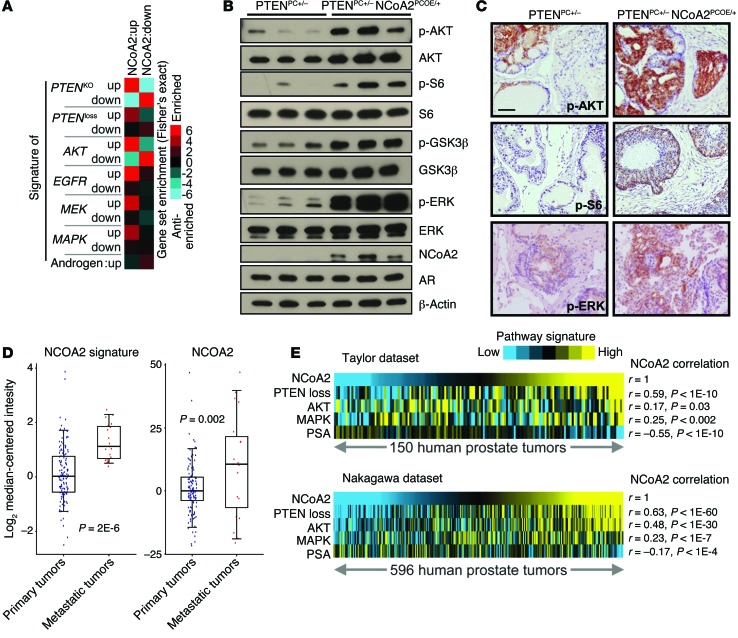
Figure 4. NCoA2 activates PI3K/AKT and MAPK signaling in PCa.
(A) RNA profiling datasets, in which a particular pathway (AKT/PTEN, EGFR, MEK, MAPK, and AR) was activated in an experimental model, were collected from various published studies (described in Supplemental Table 1). Graphic representation of the significance of gene overlap is shown (Fisher’s exact z score), for NCoA2-regulated genes, as defined by microarray from PTENPC+/– NCoA2PCOE/+ versus PTENPC+/– mice, with the various external pathway signatures. (B) Western blot analysis of phospho-AKT, AKT, downstream targets (phospho-S6 and phospho-GSK3β), AR, phospho-ERK, and total ERK in anterior prostate from 24-week-old mice as indicated. (C) IHC analysis of phospho-AKT, phospho-S6, and phospho-ERK as indicated. Scale bars: 50 μm. (D) NCoA2 expression and NCoA2 signature in primary versus metastatic PCa specimens from patients (GSE21032; ref. 9), in which each tumor expression profile was scored for manifestation of the NCoA2 signature. Box plots represent 5%, 25%, 75%, median, and 95%. P values were examined using t test. (E) Pearson’s correlations between NCoA2 signature and PTEN loss, AKT activation, MAPK, or androgen signature as reflected by PSA levels within primary prostate tumors (Taylor dataset, GSE21032, n = 150, ref. 9; Nakagawa dataset, GSE10645, n = 596, ref. 30).

