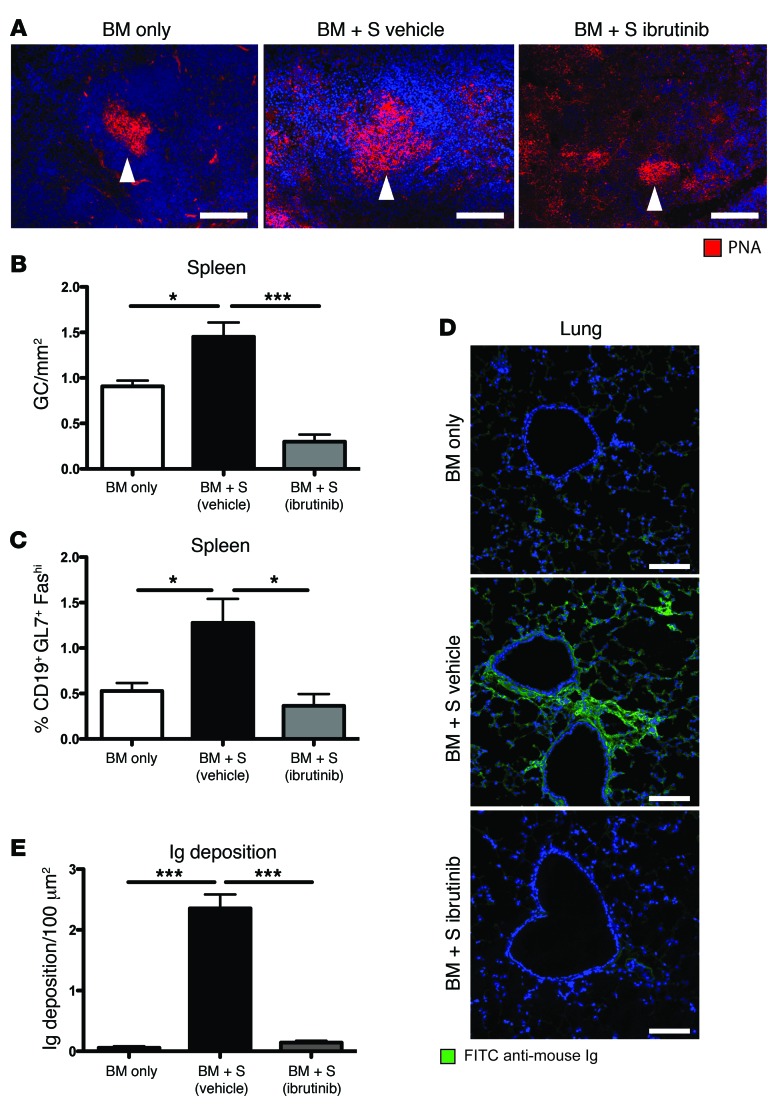
Figure 5. GC reactions and pulmonary immunoglobulin deposition are reduced with administration of ibrutinib.
(A) GCs were imaged by staining 6-μm spleen sections with PNA conjugated to rhodamine (red) and DAPI (blue). (B) GC area (GC/mm2) was calculated from PNA-stained immunofluorescent images for each animal. The average area for each cohort is displayed. Error bars indicate SEM. (C) Splenocytes were purified from transplanted mice on day 60, and frequency of GC B cells was quantified. (D) 6-μm lung sections from day 60 transplanted mice were stained with anti-mouse Ig conjugated to FITC (green) and DAPI (blue) and (E) quantified with Adobe Photoshop CS3. Representative data from 3 independent experiments. *P < 0.05; ***P < 0.001. All measurements were conducted on day 60 after HSCT. Scale bars: 100 μm.

