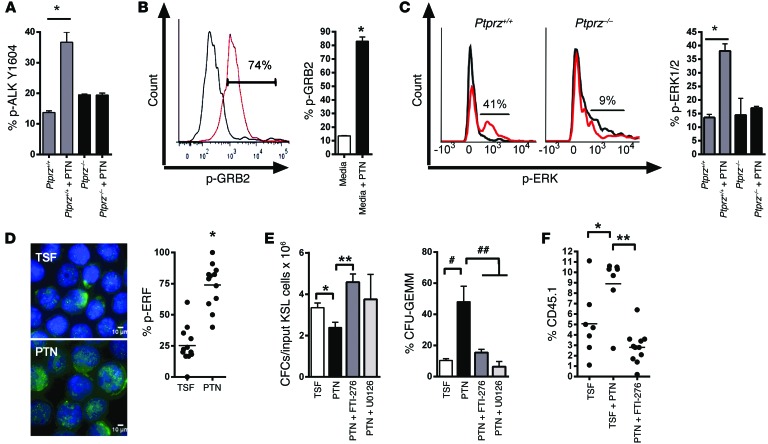
Figure 2. RAS signaling is necessary for PTN-mediated HSPC expansion.
(A) p-ALK expression in BM KSL cells from the represented groups (n = 3, *P = 0.003). (B) p-GRB2 expression in BM KSL cells treated with media alone (gray curve) or PTN (red curve), with mean percentage p-GRB2 levels shown (n = 3, *P < 0.0001). (C) Representative p-ERK1/2 expression in KSL cells treated with media alone (gray curve) or PTN (red curve), with mean percentage p-ERK1/2 levels shown (n = 5, *P < 0.001). (D) p-ERF expression (green) in BM KSL cells cultured with thrombopoietin, SCF, and FLT-3 ligand (TSF), with or without PTN, and scatter plot of p-ERF levels in KSL cells (horizontal bars represent means; n = 12, *P < 0.0001). Scale bar: 10 μm. (E) CFCs per input KSL cells and percentage CFU-GEMMs at day +7 of the represented cultures (n = 3, *P = 0.04, **P = 0.01, #P = 0.02, ##P = 0.03). (F) CD45.1+ donor cell engraftment at 8 weeks following competitive transplantation of the progeny of 10 CD34–KSL cells cultured in the conditions shown (n = 7–11 per group, *P = 0.04, **P < 0.0001).

