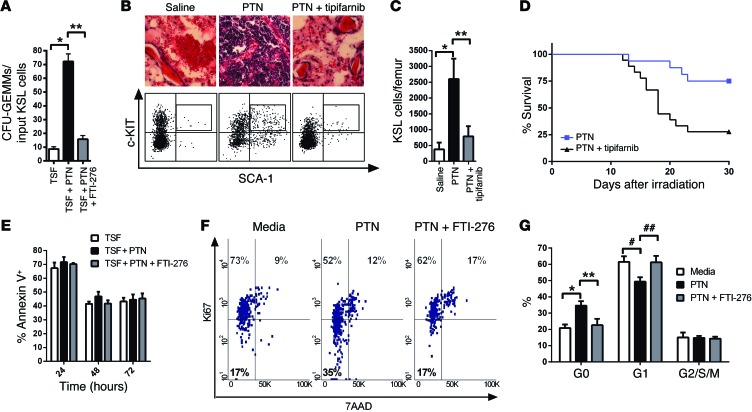
Figure 3. PTN promotes hematopoietic regeneration and survival following irradiation in a RAS-dependent manner.
(A) CFU-GEMMs at day +3 of culture of KSL cells following 300 cGy (n = 6, *P < 0.001, **P < 0.001). (B) H&E-stained femurs (original magnification, ×63) and flow cytometric analysis of KSL cells from mice at day +10 following 700 cGy and the treatments shown. (C) KSL cells per femur at day +10 following 700 cGy and the treatments shown (n = 3, *P = 0.004, **P = 0.01). (D) Survival curves of 800 cGy–irradiated mice treated with 4 μg PTN every other day, with and without 1 mg tipifarnib, through day +21 (P = 0.004, log-rank test). (E) Percentage annexin-positive KSL cells following 300 cGy (n = 5). (F) Representative percentages of KSL cells in G0 (Ki67–7AAD–), G1 (Ki67+7AAD–), and G2/SM phase (Ki67+7AAD+) at 6 hours following 300 cGy and cultured as shown. (G) Mean G0, G1, and G2/SM levels for each group (n = 5, *P = 0.004, **P = 0.04, #P = 0.02, ##P = 0.01).

