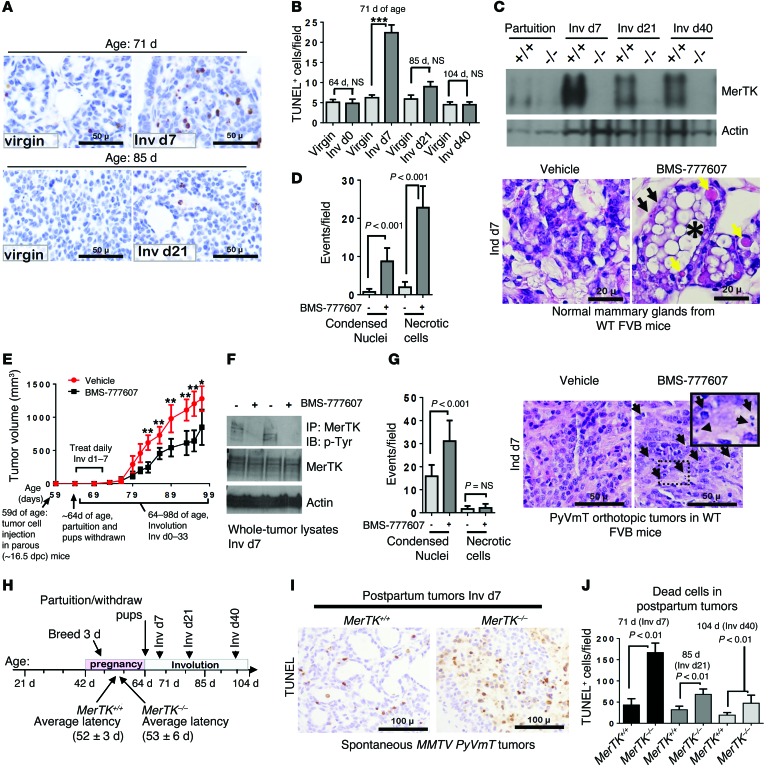
Figure 2. Increased tumor cell death and efferocytosis in ppBCs.
(A) TUNEL analysis of tumors from virgin and postpartum mice. Representative images are shown. Original magnification, ×400. (B) Average TUNEL+ cells per field (5 random fields/sample; n = 4–6). ***P < 0.001 by Student’s t test. (C) Western blot analysis of whole-tumor lysates harvested at partuition (64 days old), Inv d7 (71 days old), Inv d21 (85 days old), and Inv d40 (104 days old). +/+ denotes MerTK+/+ PyVmT tumors; –/– denotes MerTK–/– PyVmT tumors. (D) WT mice treated with BMS-777607 (Inv d1–7). Representative histological sections of mammary glands harvested 1 hour after final treatment. Black arrows indicate hypercondensed nuclei of dead cells; yellow areas indicate necrotic cells; single asterisk indicates milk fat globule. Original magnification, ×400. (E–G) Allografted ppBCs treated with BMS-777607 (Inv d1–7). (E) Tumor volume was measured 2–3 times per week and is shown as the average tumor volume ± SD. n = 6–8 per group. **P < 0.01; *P < 0.05. (F) Whole-tumor lysates and MerTK immunoprecipitates from tumor lysates were assessed by Western blot analysis. (G) Representative histological sections of tumors harvested 1 hour after final treatment on Inv d7. Arrows indicate hypercondensed nuclei of dead cells. Original magnification, ×400; ×600 (inset). (H) Schematic approach to assess ppBCs in MerTK+/+ PyVmT and MerTK–/– PyVmT mice. Average latency is indicated on timeline. P = NS by log-rank test. (I) TUNEL analysis of tumors at Inv d7. Representative images are shown. Original magnification, ×400. (J) Average TUNEL+ cells per field (5 fields/sample; n = 4–6 per condition). P < 0.01 by Student’s t test.

