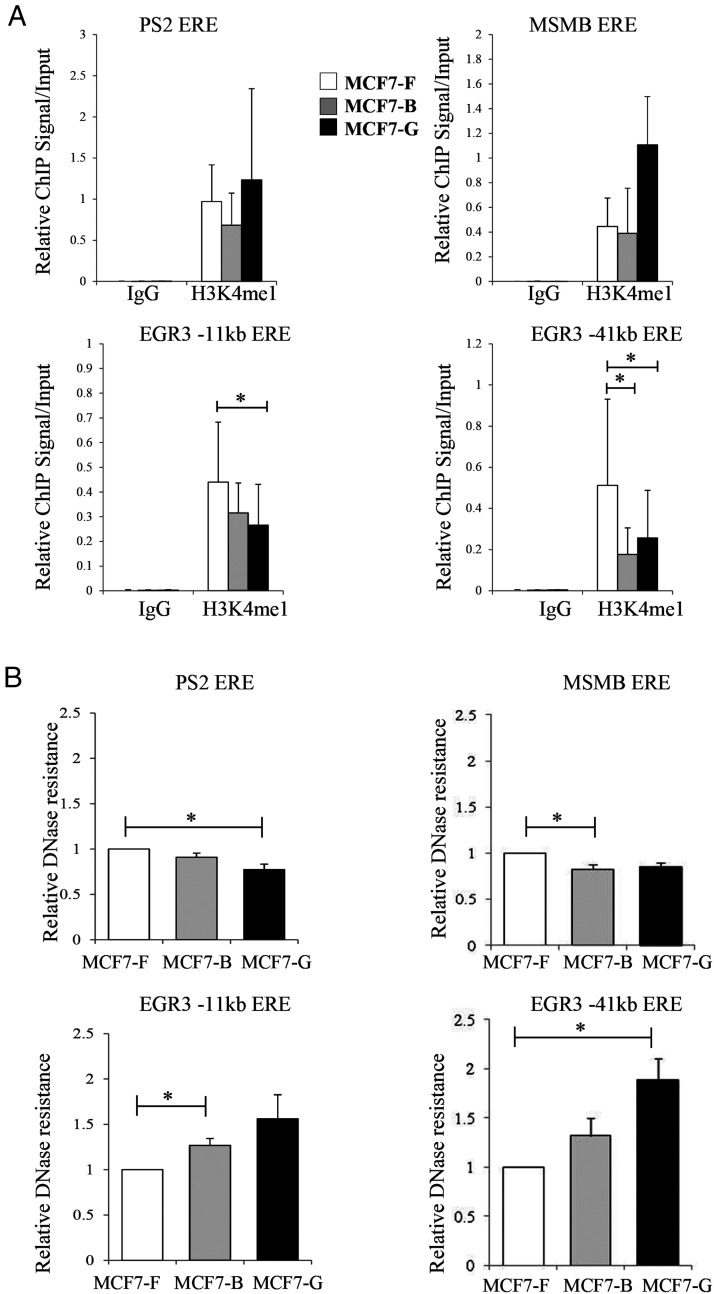
Figure 5.
Epigenetic reprogramming is seen at EGR3 response elements. A, ChIP assays were performed on the MCF7-F, MCF7-B, and MCF7-G cell lines prior to ER activation with antibodies specific for the enhancer mark H3K4me1. ChIP-enriched DNA was analyzed by quantitative PCR with real-time primers specific for response elements near the PS2, MSMB, and EGR3 genes. Data are depicted as the mean ± SE (n = 3). B, DNase accessibility assays were performed under identical conditions to the ChIP assays. Relative DNase resistance was measured by quantitative PCR at the response elements associated with the PS2, MSMB, and EGR3 genes. Data represent the DNA resistant to digestion relative to MCF7-F cells and is depicted as the mean ± SE (n = 3). *, P ≤ .05.

