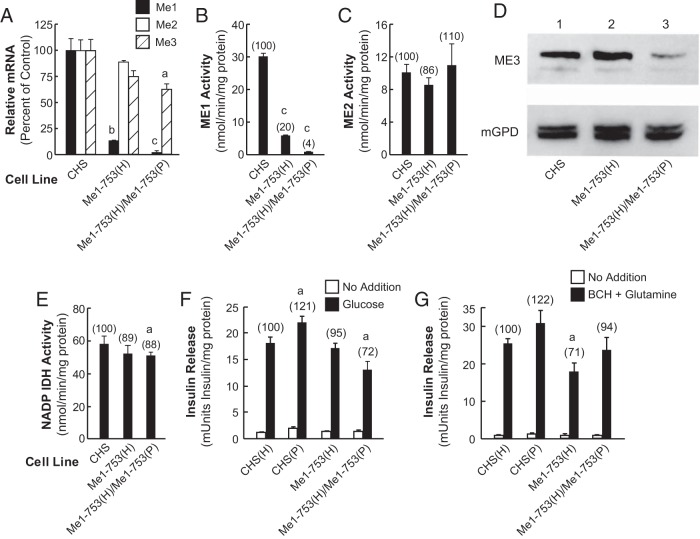
Figure 1.
Decreases in Me1 mRNA and ME1 activity do not or only slightly inhibit insulin secretion. A, Quantitative RT-PCR of Me1, Me2, and Me3 mRNA are expressed as the ratio of each mRNA to that of glutamate dehydrogenase mRNA as an internal standard. The results represent the means ± SE of three independent experiments, each run in duplicate and are expressed as percentage of the CHS control equal to 100% using CHS cDNA to prepare a standard curve. The cDNA was prepared from total RNA obtained from CHS cells grown under the same condition as the experimental cell lines. B, ME1 enzyme activity in CHS control, Me1-753(H), and Me1-753(H)/Me1-753(P) cell lines. C, ME2 enzyme activity in the mitochondria of the previous cell lines. D, Immunoblot of ME3 protein in the mitochondria of the indicated cell lines. There was 35 μg of the mitochondrial protein samples per lane. E, NADP-dependent IDH enzyme activity as a control. Enzyme activities are expressed as the means ± SE of four different enzyme activity measurements using cells with different passage numbers. Numbers in parentheses show activity as a percentage of the CHS control. a, P < .05; b, P < .01; c, P < .001 compared with CHS control. F, Slight inhibition of glucose-stimulated insulin release in the Me1 double-knockdown cell line. Glucose (11.1 mM)-stimulated and unstimulated insulin release. G, Ten millimoles BCH plus 10 mM glutamine stimulated and unstimulated insulin release. Insulin release values are expressed as the means ± SE of four different insulin release measurements for each cell line with different passage numbers and the values are expressed in milliunits of insulin per milligram protein. Numbers in parentheses show the percentage of insulin release relative to the control CHS cell line. a, P < .05 compared with CHS control.

