Figure 4.
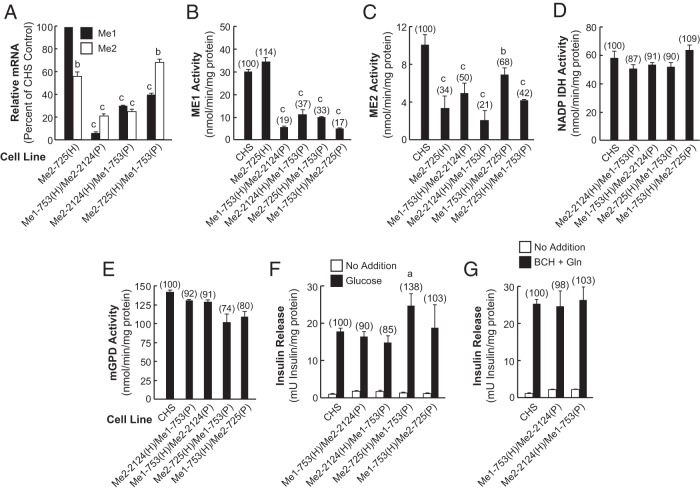
Knockdown of Me1 and Me2 in the same cell line lowers Me1 and Me2 mRNA and enzyme activities and does not inhibit insulin release. A, Relative Me1 and Me2 mRNA levels. The results represent the means ± SE of three independent experiments each run in duplicate as described in the legend of Figure 1A. B, ME1 enzyme activity. C, Mitochondrial ME2 enzyme activity. D, NADP-IDH activity as an untargeted control. E, mGPD enzyme activity as an untargeted control. Results are the means ± SE of four experiments for ME2 and mGPD measurement and six experiments for ME1 and IDH enzyme activity measurements for each cell line with different passage numbers, and knockdown of Me2 alone [Me2-725(H)] is for comparison. Numbers in parentheses indicate percentage of the CHS control. a, P < .01; b, P < .001 compared with CHS control. F, Glucose (11.1 mM)-stimulated insulin and unstimulated insulin release. G, BCH-plus-glutamine (10.0 mM each)-stimulated and unstimulated insulin release. Insulin release results are the means ± SE of four different insulin release measurements for each cell line with different passage numbers, and the values are expressed in milliunits of insulin per milligram of protein. Numbers in parentheses above each bar show insulin release as a percentage of the control CHS cell line. a, P < .05 compared with CHS control. Gln, glutamine.

