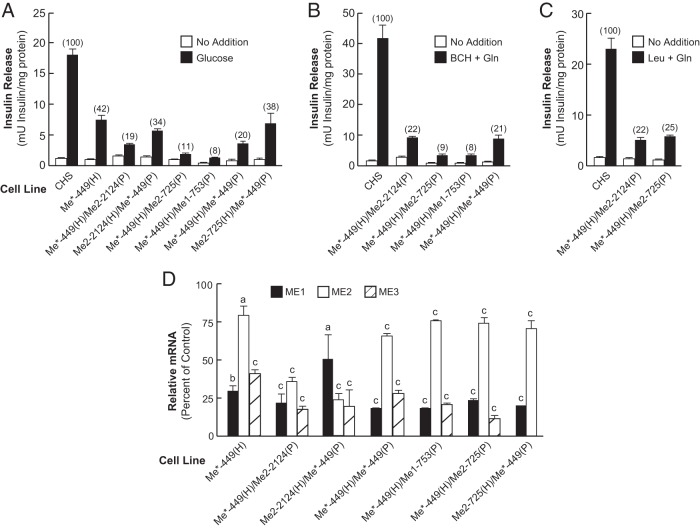
Figure 5.
Decreased insulin release in response to glucose, BCH-plus-glutamine, or leucine-plus-glutamine in the single Me*-449 and its double-knockdown cell line derivatives with decreased ME1, ME2, and ME3. A, Glucose-stimulated insulin release. B, BCH-plus-glutamine-stimulated insulin release. C, Leucine-plus-glutamine-stimulated insulin release. Insulin release results are the mean ± SE of 7–12 experiments using cell preparations of different passage number for each cell line. The concentration of glucose was 11.1 mM and that of the other secretagogues was 10 mM each. The percentage of values relative to the CHS control are shown in parentheses above each bar. All values of 42% of the CHS control or lower were significantly different from the control to the level of P < .001. D, Lower Me1 and Me2 and/or Me3 mRNAs in Me3 single Me*-449 and double-knockdown cells. The quantitative RT-PCR values are expressed as a percentage of the CHS control cell line (means ± SE of four experiments, each run in duplicate using cell preparations of different passage numbers). a, P < .05; b, P < .01; c, P < .001 compared with CHS control. Gln, glutamine.

