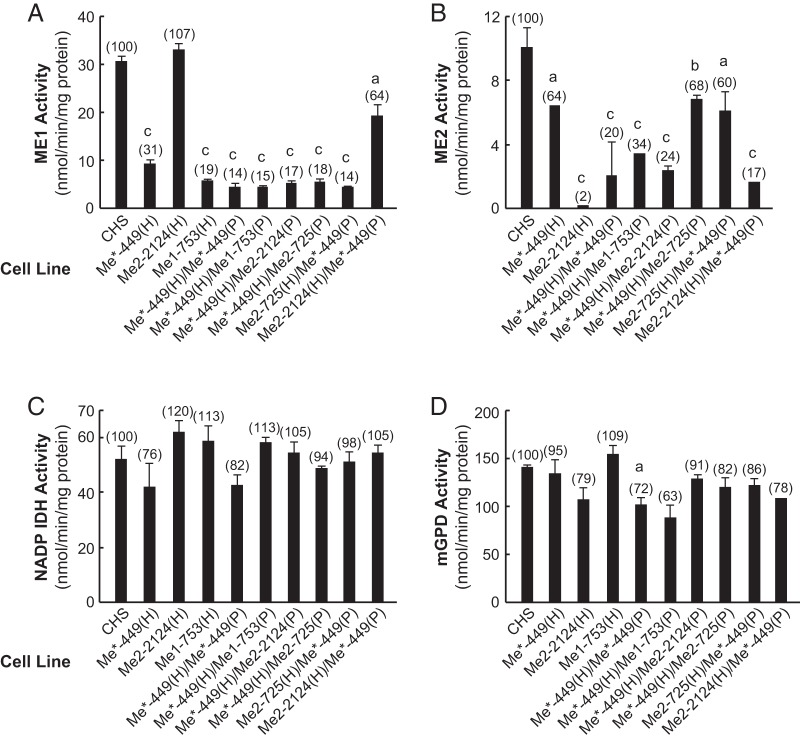
Figure 6.
Lower ME1 and ME2 enzyme activities in Me*-449 single- and double-knockdown cell lines without significant lowering of control enzyme activities of NADP-IDH and mGPD. A, ME1 activity. B, Mitochondrial ME2 activity. C, Activity of NADP-dependent IDH as an untargeted control. D, mGPD activity as an untargeted control. Activities as a percentage of the CHS control are shown in parentheses. Results are the means ± SE of 4–10 experiments. a, P < .05; b, P < .01; c, P < .001 compared with CHS control.

