
Figure 7.
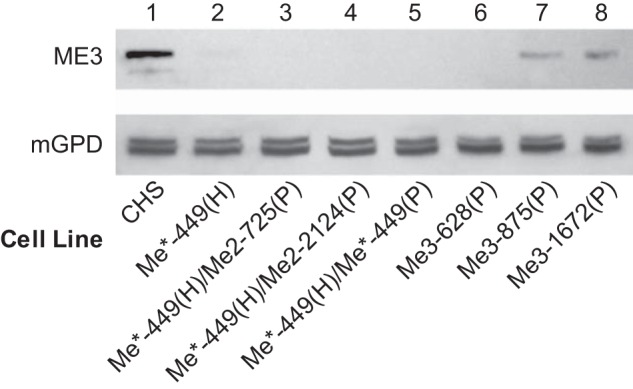
Knockdown of ME3 protein as judged from immunoblot analysis. There was 35 μg of mitochondrial protein per lane. Immunoblot of ME3 protein levels in control and single- and double-knockdown cell lines as indicated. Lane 1 shows the CHS control. Lanes 2–5 are mitochondrial samples of single Me*-449 and double-knockdown cell lines derived from Me*-449 as indicated. Lanes 6–8 are mitochondrial protein samples of Me3 knockdown cells Me3-628, Me3-875, and Me3-1672, respectively.