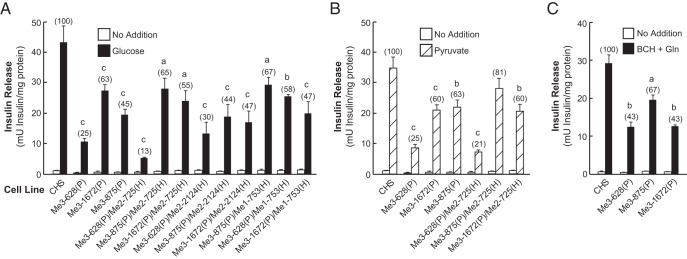
Figure 9.

Decreased glucose-, pyruvate-, and BCH-plus-glutamine-stimulated insulin release in the cell lines with Me3 single and double knockdown in combination with Me1 or Me2 knockdown. A, Glucose (11.1 mM)-stimulated insulin release. B, Pyruvate (10 mM)-stimulated insulin release. C, 10 mM BCH-plus-10 mM glutamine-stimulated insulin release. Results are the mean ± SE of 3–12 replicate experiments for each cell line. Percentages relative to the CHS control cell line are shown in parentheses. a, P < .05; b, P < .01; c, P < .001 compared with CHS control.
