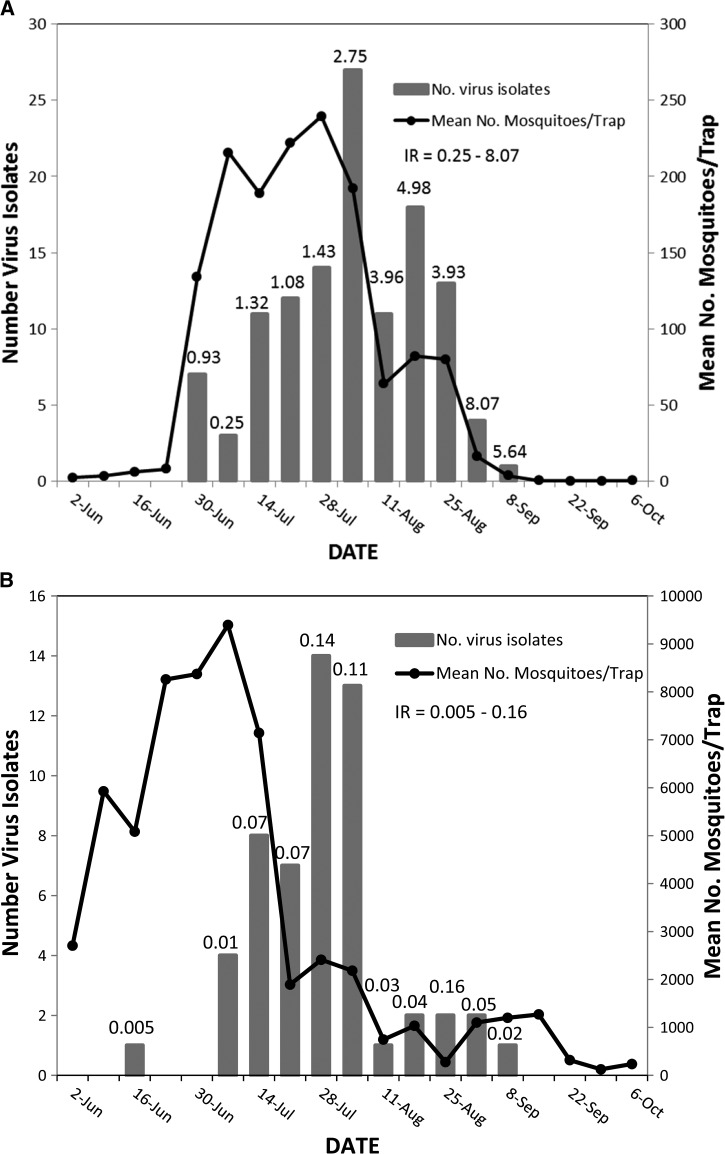
Figure 2.
(A) Weekly number of West Nile virus isolations and infection rates (IR) relative to mean numbers of Culex tarsalis per trap-night, North Dakota, 2003–2006. (B) Weekly number of West Nile virus isolations and infection rates relative to mean numbers of Aedes vexans per trap-night, North Dakota, 2003–2006.

