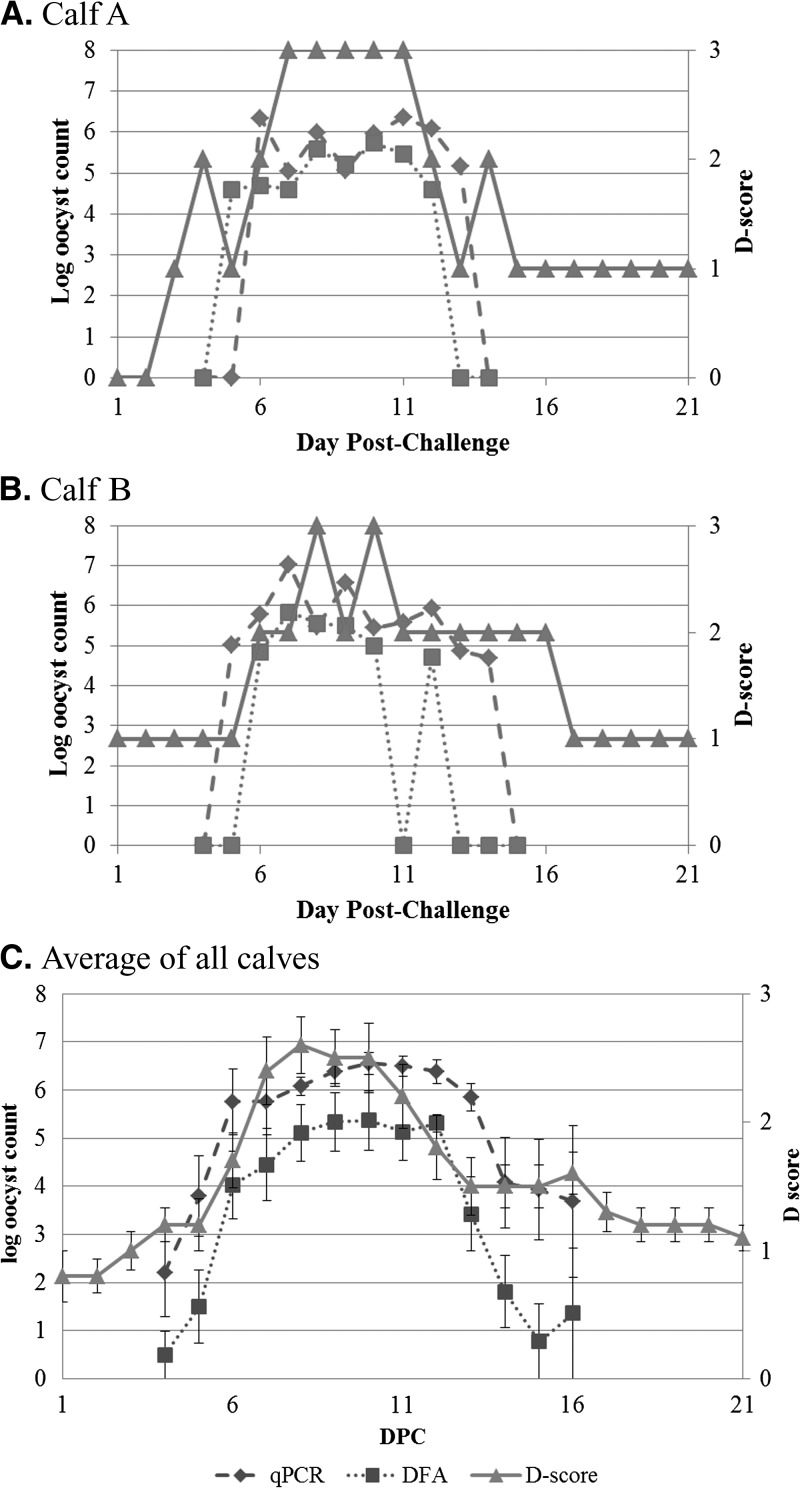
Figure 2.
(A) Calf A. (B) Calf B. (C) Average of all calves Oocyst count versus diarrhea score. Oocyst counts from both immunofluorescence microscopy (DFA, squares, dotted line) and real-time polymerase chain reaction (qPCR) (diamonds, dashed line) along with the diarrhea score (D-score, triangles, solid line) were plotted against the day post-challenge. Fecal data were available for all 10 calves at all time points except Days 15 and 16 where only 5–9 samples were available. Data shown as mean + standard error.

