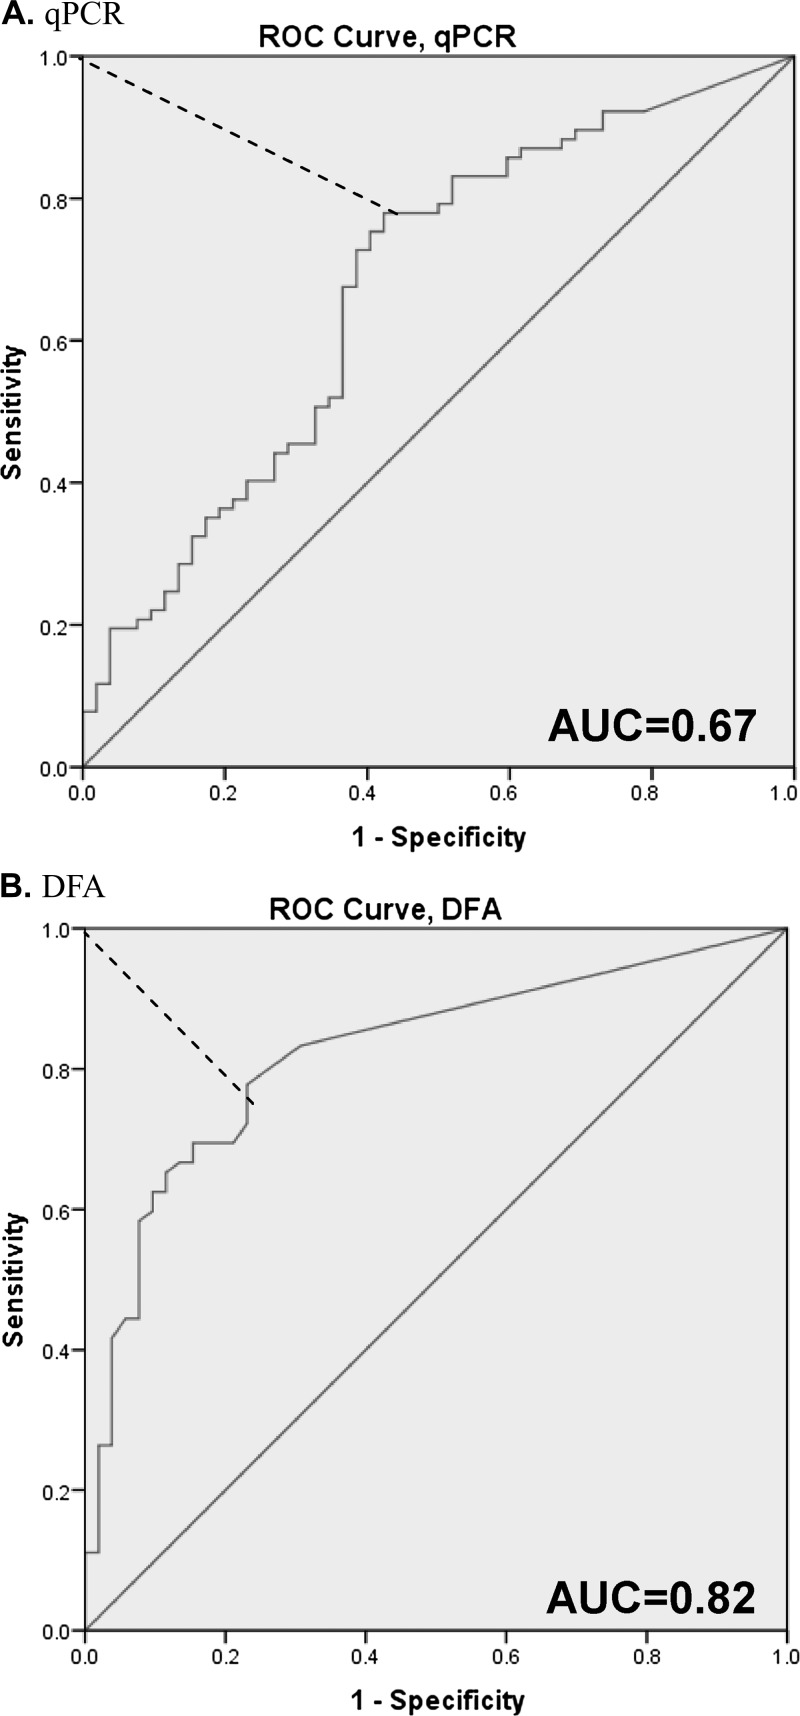
Figure 3.
(A) real-time polymerase chain reaction (qPCR). (B) Direct fluorescent antibody (DFA) receiver operating characteristic (ROC) analysis of qPCR and DFA versus diarrhea score. These ROC plots show sensitivity and (1-specificity) across oocyst counts, using the diarrhea score as a gold standard for positivity. AUC, area under the curve. The red dotted line depicts the Youden index of maximum (sensitivity + specificity-1) value.

