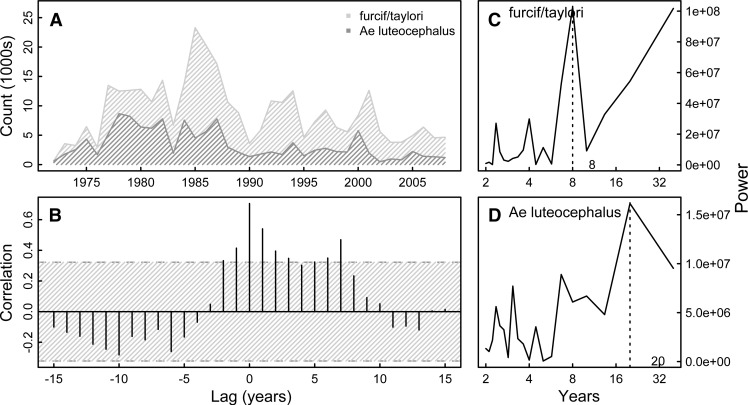
Figure 3.
Aedes mosquito captures and cross-correlation. Figure shows time series of Ae. luteocephalus and Ae. furcifer/Ae. taylori captures over time (A) with the corresponding cross-correlation plot (B) and Fourier spectra (C and D). Hatched area in B indicates 95% CI assuming an underlying white noise process.17 We see marked cross-correlation between mosquito isolates up to lags of 7 years. Ae. furcifer/Ae. taylori have a dominant periodicity of 8 years, and Ae. luteocephalus has a dominant periodicity of 20 years.

