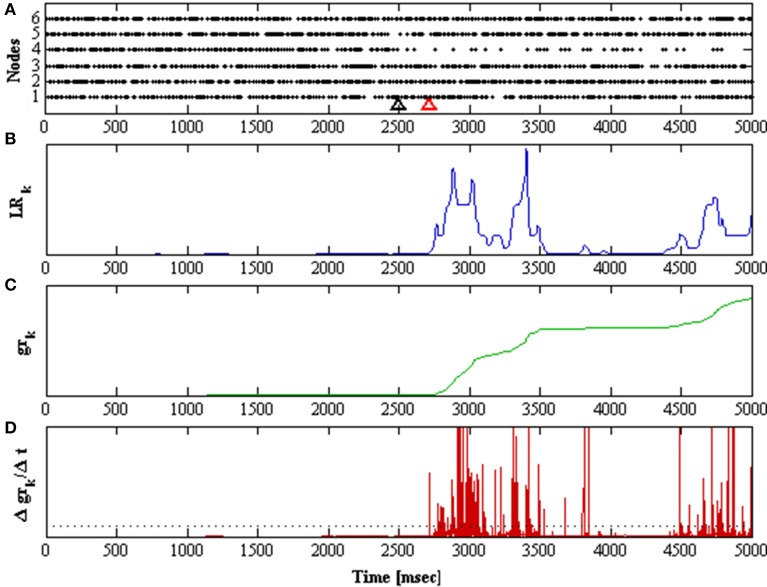
Figure 5.
Shows a 5 second simulation of the network. The network is initially in stable mode and at t = 2.5 s it is perturbed, taking λ1 to 200 ms−1. (A) Raster plots for all nodes in the network. The black arrow marks when the perturbation was applied, the red arrow marks when it was detected. (B) Likelihood ratio of the observation distributions over time. (C) The cumulative function gr of the likelihood ratio over time. (D) The derivative of the cumulative function over time.

