
Figure 2.
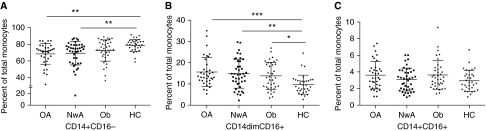
Between study group comparison of monocyte activation. Monocyte activation was defined by comparing the proportion of (A) classical, (B) patrolling, and (C) resident monocytes in each study group. The middle bar represents the mean values and the side bars represent the 25th and 75th percentile. HC = healthy control subjects; NwA = normal-weight subjects with asthma; OA = obese subjects with asthma; Ob = obese subjects without asthma. The asterisks denote statistically significant between-group differences (*P < 0.05, **P < 0.01, ***P < 0.001).