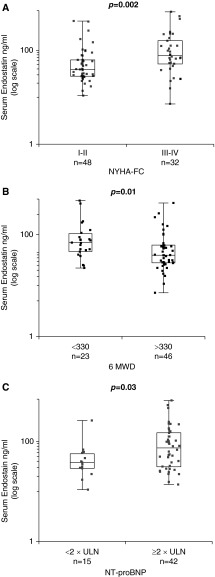
Figure 1.
Box and whisker plots of serum endostatin (ES) levels in patients with pulmonary arterial hypertension (PAH) with (A) New York Heart Association functional class (NYHA-FC) I to II versus III to IV symptoms, (B) 6-minute-walk distance (6 MWD) < 330 versus ≥330 m, and (C) N-terminal pro-brain natriuretic peptide (NT-proBNP) ≥2 × upper limit of normal (ULN) versus <2 × ULN. Boxes represent the interquartile range (IQR) and the horizontal lines are the medians. Whiskers represent the closest values within 1.5 times the IQR.

