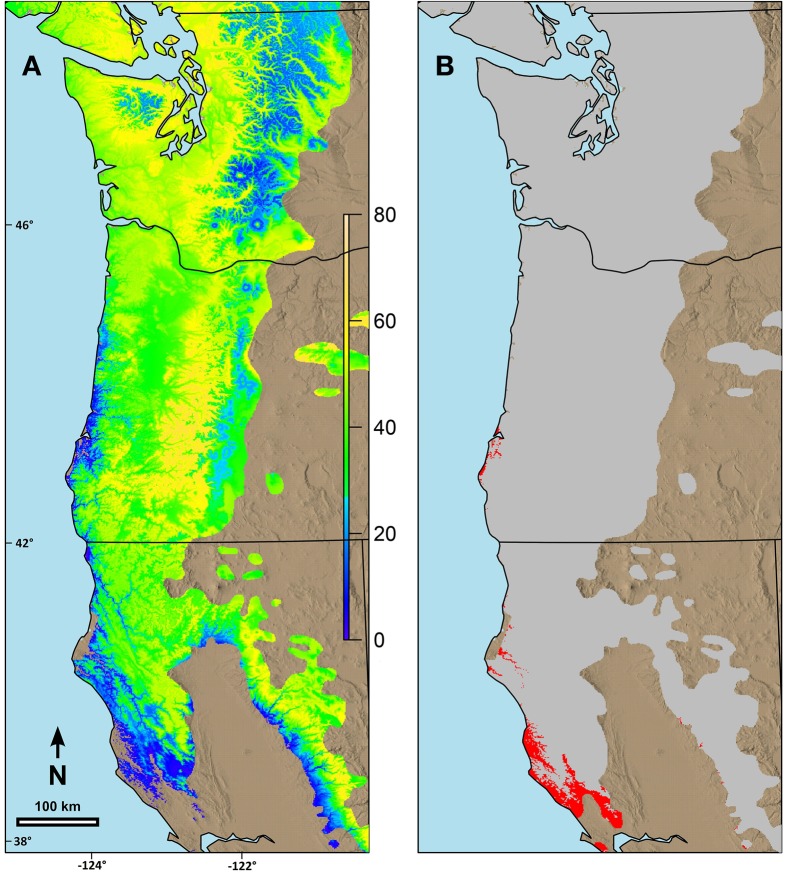
Figure 5.
Predicted changes in date of terminal budburst for Douglas-fir between current climatic conditions and those predicted in 2080 (consensus, A2) using ClimateWNA for the current range of the species in the study area. (A) Sites with earlier date of budburst in 2080 than currently, (B) Sites with later date of budburst than currently. Under (A) the color scale indicates number of days earlier that budburst is predicted to occur by 2080. Under (B) the areas in red are where the predicted date of budburst is predicted to be later in 2080 than currently. Numbers on the left and the bottom of the map refer to latitude (north) and longitude (west).

