
Figure 3. LytS independent lrgAB expression during planktonic growth.
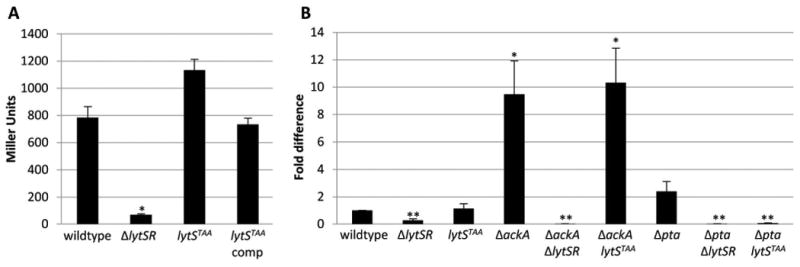
A. Cultures of KB5019 (wildtype), KB5020 (ΔlytSR), KB5024 (lytSTAA), KB5024 (pML11) (lytS complement) were grown in TSB to late exponential phase, harvested, and the β-galactosidase activity (Miller Units) generated by the chromosomal PlrgAB-lacZ was measured. The data presented are the average of two biological replicates (n=2) with standard error of the mean indicated. A two-tailed Student T-test assuming equal variances was used to determine statistical significance compared to wildtype. *p<0.05 B. Cultures of UAMS-1 (wildtype), KB5010 (ΔlytSR), KB5014 (lytSTAA), KB8000 (ΔackA), KB5050 (ΔackA-ΔlytSR), KB5051 (ΔackA-lytSTAA), KB8001 (Δpta), KB5046 (Δpta-ΔlytSR), and KB5047 (Δpta-lytSTAA) were grown in TSB to late exponential phase and harvested. RNA was isolated from the cells and qRT-PCR was utilized to quantify lrgA transcripts relative to the wild-type strains. The data presented are the average of two biological replicates (n=2) with standard error of the mean indicated. A two-tailed Student T-test assuming equal variances was used to determine statistical significance compared to wildtype. *p<0.05, **p<0.005