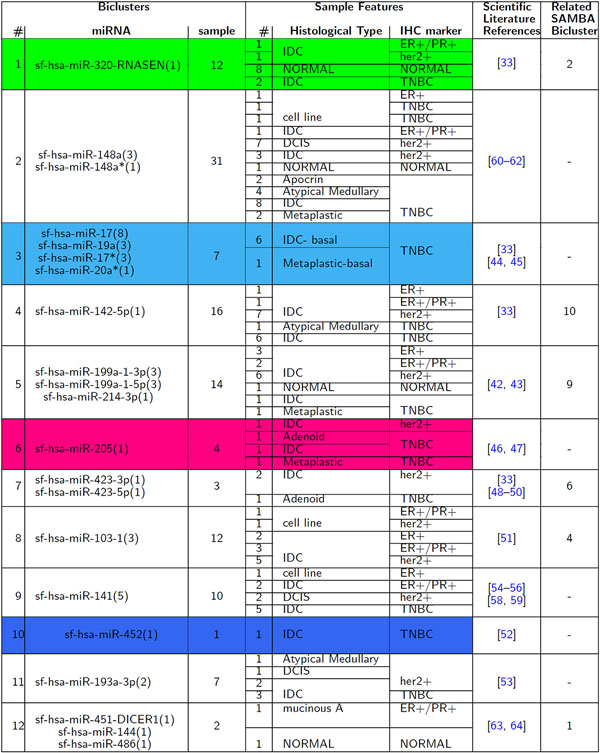
Figure 4.

Table of biclustering results. It reports, for each obtained bicluster, the group of miRNAs and the number of patients. In addition, for each patient in bicluster, some main characteristics are reported. The last two columns contain references provided by literature works and the number of the related bicluster, if any, discovered by the SAMBA algorithm. All the biclusters obtained with SAMBA algorithm are provided in the Supplementary material, Additional file 1 and 2. See caption of Figure 3 for details about red, blue, azure and green rectangles.
