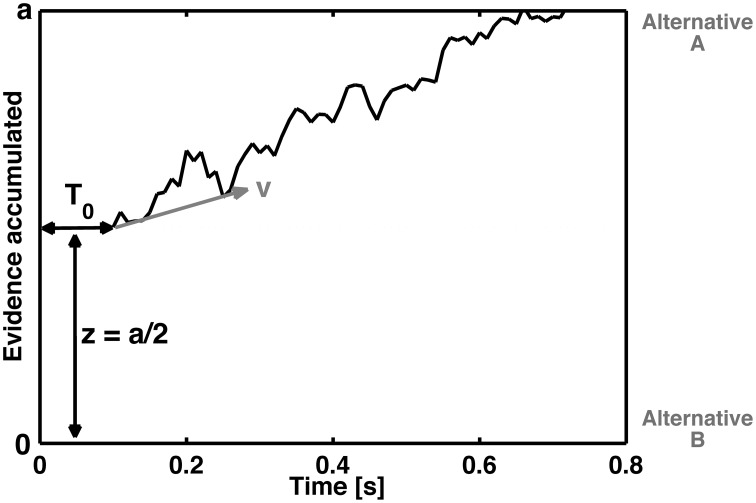
Figure 1.
Schematic representation of the diffusion process of a single decision between two response alternatives A and B. The curved line represents the accumulation of information over time until boundary separation (a) is reached, which is the time point of the decision for the corresponding response. The reaction time is therefore a function of the boundary separation, the speed of information processing (as reflected by the steepness of z), the non-decisional time T0 (which reflects basic stimulus processing) and the starting point (z) (which refers to how conservative or liberal the subject is with respect to error commissioning or to one of the two response alternatives).

