Figure 2.
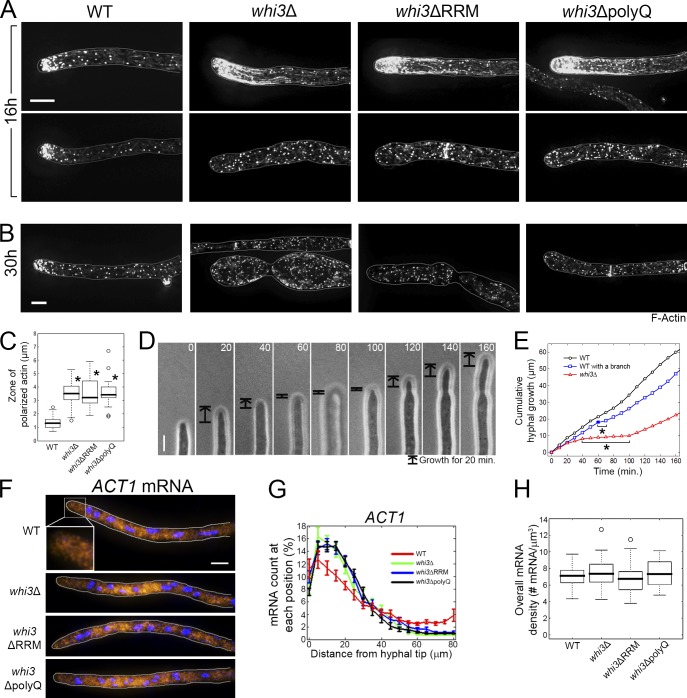
F-actin, but not actin transcripts, is mislocalized in whi3 mutants. (A and B) F-actin is visualized in cells grown for 16 h (A) or 30 h (B) at 30°C by Phalloidin staining. Cells are outlined in gray. (A) Top and bottom panels represent hyperpolarized and depolarized actin localization, respectively (n > 105). (C) The length of the zone where actin is polarized (Materials and methods) is measured on the cell growth axis. *, P < 0.01 compared with wild type using a t test. n > 105. (D) Montage of a hyphal growth of whi3Δ. Time points (min) are indicated. (E) Cumulative hyphal growth of wild type with or without branch emergence (closed box), and whi3Δ from D. Asterisks indicate a pause of growth. (D and E) The data shown are from one representative experiment out of 46 (WT) and 6 (whi3Δ). (F) ACT1 mRNAs (yellow) are localized by smFISH, and DNA (blue) is visualized by Hoechst staining. Cells are outlined in gray. The inset shows a 5× magnification. (G) ACT1 mRNAs were counted on every 5-µm distance from the growing tip and summed along each hypha. The mRNA count at each point (5 µm) was converted to the percentage of total number of mRNAs detected in the hypha. Error bars indicate SEM. (G and H) n > 35 for each strain. (H) Overall mRNA density (total number mRNA/total hyphal volume) in each strain. P > 0.39 for all whi3 mutants compared to wild type using a t test. Bars, 5 µm.

