Figure 5.
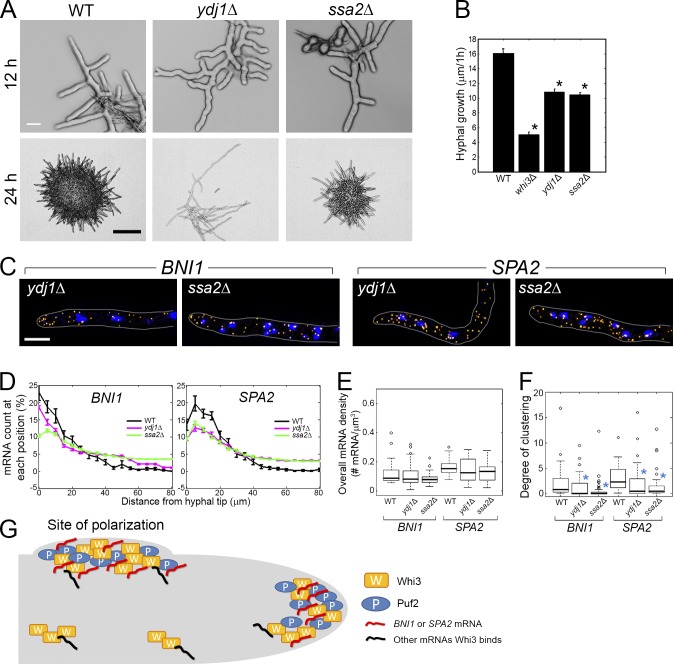
Ydj1 and Ssa2 affect transcript localization for cell polarity. (A) Cells grown for 12 or 24 h (30°C). Bars: (top) 10 µm; (bottom) 200 µm. (B) The 1-h lateral growth of the hyphal tip was measured with an FITC-ConA pulse. Error bars indicate SEM. *, P < 0.01. (C) BNI1 or SPA2 transcripts (yellow) are localized. Blue, DNA. Cells are outlined in gray. Bar, 5 µm. (D) BNI1 or SPA2 mRNAs were counted from each growing tip. Error bars indicate SEM. (D–F) n > 38 for each strain. (E) Overall mRNA density in mutants is compared with wild type. P > 0.24 for all strains. (F) Degree of clustering in mutants is compared with wild type. *, P < 0.01 by KS test. (G) Working model. Whi3 and Puf2 form complexes at new and preexisting sites of polarization (hyphal tips or nascent lateral branches) in the presence of polarity mRNAs.

