Figure 1.
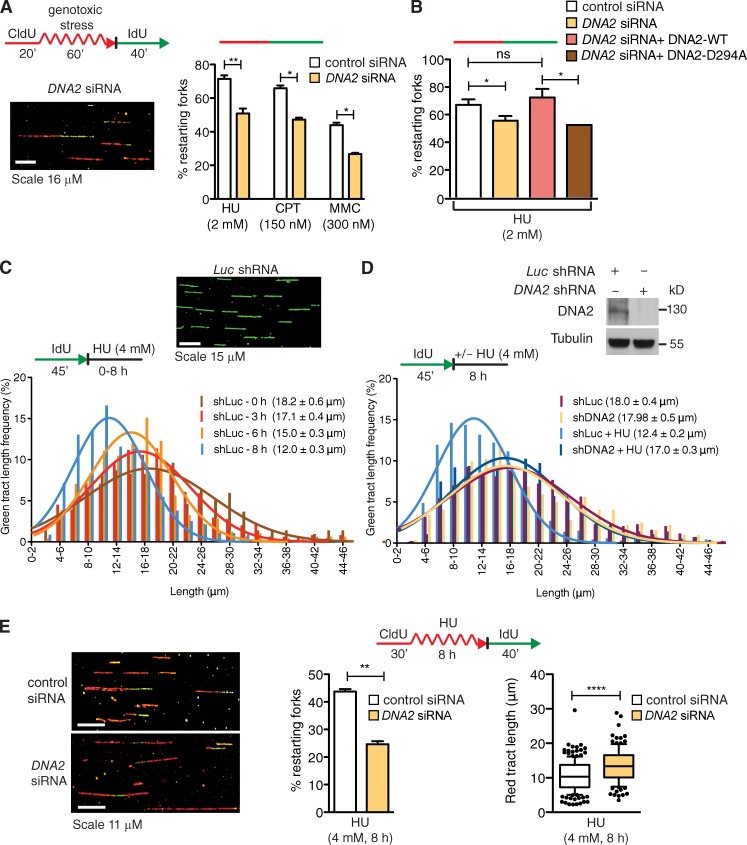
DNA2 is required for replication fork restart and stalled fork processing upon genotoxic stress. (A) Schematic of DNA fiber tract analysis. U-2 OS cells were transfected with control siRNA or DNA2 siRNA before CldU or IdU labeling. Red tracts, CldU; curved red tracts, CldU with genotoxic agents (HU or CPT or MMC); green tracts, IdU. (bottom) Representative DNA fiber image. (right) quantification of red-green contiguous tracts (restarting forks). Mean shown, n = 3. Error bars, standard error. ns, not significant; *, P < 0.05; **, P < 0.01 (paired t test). (B) Quantification of restarting forks in DNA2-depleted cells expressing DNA-WT or DNA2-D294A. ns, not significant; *, P < 0.05 (paired Student’s t test). (C, top) Representative DNA fiber image. (bottom) Representative IdU tract length distributions in Luc-depleted cells during different exposure time to HU (out of 3 repeats; n ≥ 300 tracts scored for each dataset). Mean tract lengths are indicated in parentheses. (D) Top, DNA2 expression after shRNA knockdown. Bottom, representative IdU tracts in DNA2-depleted U-2 OS cells in the presence or absence of HU (out of 2 repeats; n ≥ 700 scored for each dataset). (E, left) Representative DNA fiber images. (middle) Quantification of red-green contiguous tracts (restarting forks) after 8 h of HU. Mean shown, n = 3. Error bars, standard error. **, P < 0.01 (paired Student’s t test). (right) Statistical analysis of CldU tracts detected within contiguous red-green tracts. Whiskers the 10th and 90th percentiles. ****, P < 0.0001 (Mann-Whitney test).

