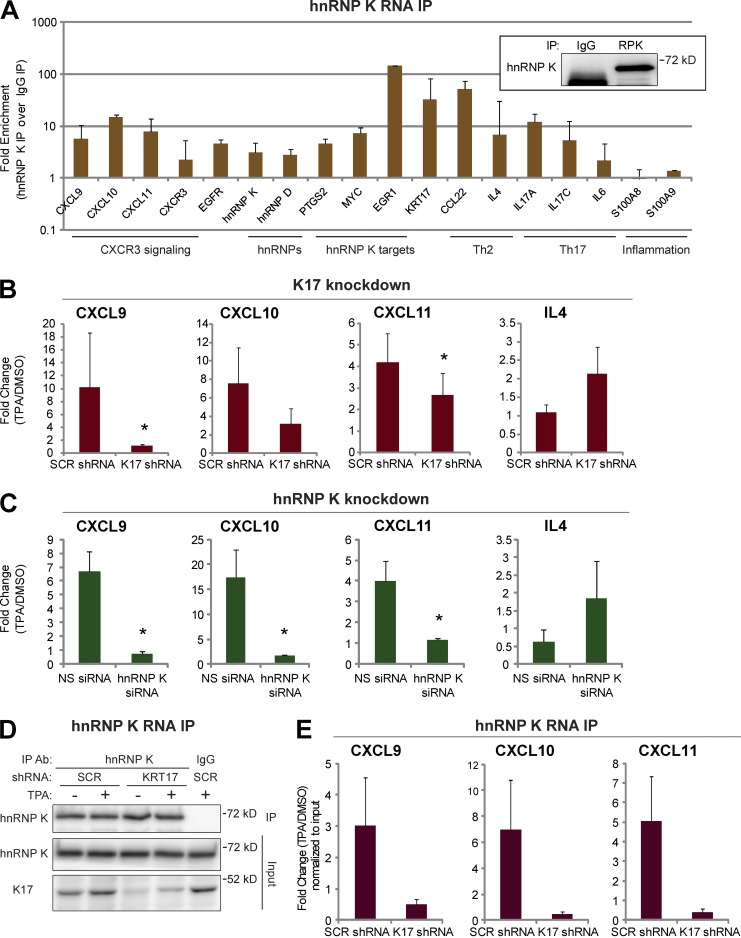
Figure 2.
CXCR3 ligands are hnRNP K–bound and regulated in a K17-dependent manner. (A) RNA IP with anti–hnRNP K antibody or IgG control was performed in A431 cells. mRNA levels of the indicated genes from immunoprecipitates were measured using qRT-PCR. Fold enrichment normalized to IgG control is shown in a log scale. Data from five experimental repeats are represented as mean ± SEM (error bars). (inset) Immunoblotting showing hnRNP K (RPK) pull-down. IP with anti–hnRNP K (RPK) antibody or IgG was performed. Immunoblotting was performed with an hnRNP K antibody. (B) A431 cells stably expressing SCR or KRT17 shRNA were treated with 200 nM TPA or DMSO (vehicle control) for 1.5 h. mRNA levels of the indicated genes were measured using qRT-PCR. Data from nine experimental repeats were normalized to DMSO control and are represented as mean ± SEM (error bars). *, P < 0.05. (C) A431 cells transfected with NS or hnRNP K siRNA (RPK1) were treated with 200 nM TPA or DMSO (vehicle control) for 1.5 h. mRNA levels of the indicated genes were measured using qRT-PCR. Data from 10 experimental repeats were normalized to DMSO control and are represented as mean ± SEM (error bars). *, P < 0.04. (D) RNA IP with anti–hnRNP K antibody was performed in 200 nM TPA- or DMSO-treated (16 h) A431 cells stably expressing SCR or KRT17 shRNA. The Western blot shows the extent of hnRNP K pull-down. IP with anti–hnRNP K antibody or IgG was performed. Immunoblotting was performed with antibodies against the indicated proteins. (E) mRNA levels of the indicated genes from hnRNP K immunoprecipitates (D) were measured using qRT-PCR. Data from five experimental repeats were normalized to DMSO control and input, and are represented as mean ± SEM (error bars).

