Figure 4.

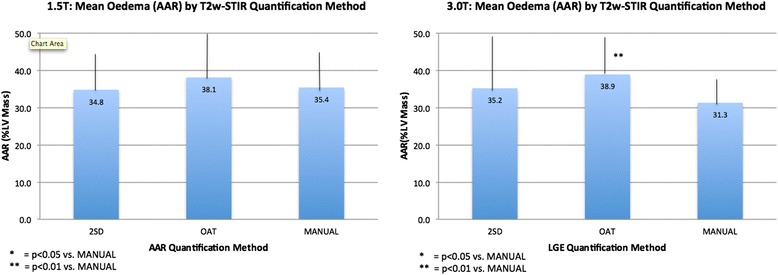
Mean Area-At-Risk (AAR) by Quantification Method. Left panel 1.5T and right panel 3.0T. AAR compared using 2SD, OAT and manual quantification. IS = infarct size, OAT = Otsu’s Automated Thresholding, 2SD = >2 standard deviations.

Mean Area-At-Risk (AAR) by Quantification Method. Left panel 1.5T and right panel 3.0T. AAR compared using 2SD, OAT and manual quantification. IS = infarct size, OAT = Otsu’s Automated Thresholding, 2SD = >2 standard deviations.