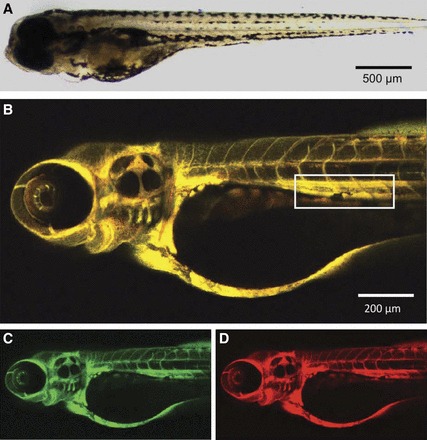
Fig. 1.

Intravascular injection of dextrans in zebrafish larvae (4 days postfertilization). A: an anesthetized larva positioned on its side for imaging. B–D: maximum intensity projection of a z-stack 45 min after injection of Alexa fluor 647-conjugated 10-kDa dextran (red) and FITC-conjugated 500-kDa dextran (green). The box in B marks the region of interest for the quantification of dextran clearance, comprising a part of the dorsal aorta and of the cardinal vein.
