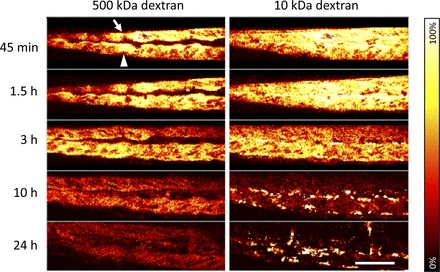
Fig. 3.

Dextran clearance from the blood stream. Intensity time series of a section of the dorsal aorta (arrow) and cardinal vein (arrowhead) in vivo after injection of Alexa fluor 647-conjugated 10-kDa dextran and FITC-conjugated 500-kDa dextran are shown. The intensity in both channels decreased over time. The intravascular signal of 10-kDa dextran approached zero between 10 and 24 h after injection. At the same time, bright, isolated spots developed due to endocytosis of 10-kDa dextran. Scale bar = 50 μm.
