
Fig. 2.
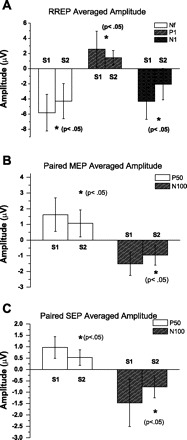
A: group averaged RREP Nf, P1, and N1 peak amplitudes (mean ± SD) for S1 and S2. The Nf peak amplitude for S1 and S2 is for the F4 channel. The P1 peak amplitude for S1 and S2 is for the C4′ channel. The N1 peak amplitude for S1 and S2 is for the Cz channel. *Significant difference (P < 0.05) between S1 and S2 for each peak. There was a significant reduction of the S2 amplitude for Nf, P1, and N1 peaks. B: group averaged MEP P50 and N100 peak amplitudes (mean ± SD) for S1 and S2. The P50 peak amplitude for S1 and S2 is for the C3′ channel. The N100 peak amplitude for S1 and S2 is for the Cz channel. *Significant difference (P < 0.05) between S1 and S2 for each peak. There was a significant reduction of the S2 amplitude for P50 and N100 peaks. C: group averaged SEP P50 and N100 peak amplitudes (mean ± SD) for S1 and S2. The P50 peak amplitude for S1 and S2 is for the C3′ channel. The N100 peak amplitude for S1 and S2 is for the Cz channel. *Significant difference (P < 0.05) between S1 and S2 for each peak. There was a significant reduction of the S2 amplitude for P50 and N100 peaks.