
Fig. 3.
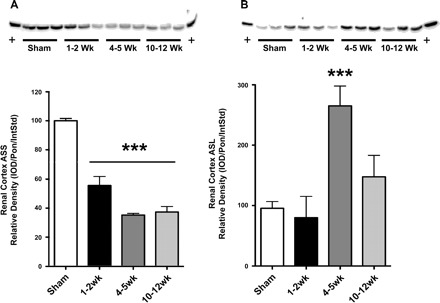
Argininosuccinate synthase (ASS) and lyase (ASL) protein expression. Shown is renal cortex ASS (A) and ASL (B) protein expression per milligram total protein with density analysis and representative blot. Protein blots are shown with equal protein loading in each lane, and densitometry is represented in graphs. Statistics comparing each injury to sham were done with 1-way ANOVA. *P < 0.05, **P < 0.01, ***P < 0.001 vs. sham (n = 6/group).