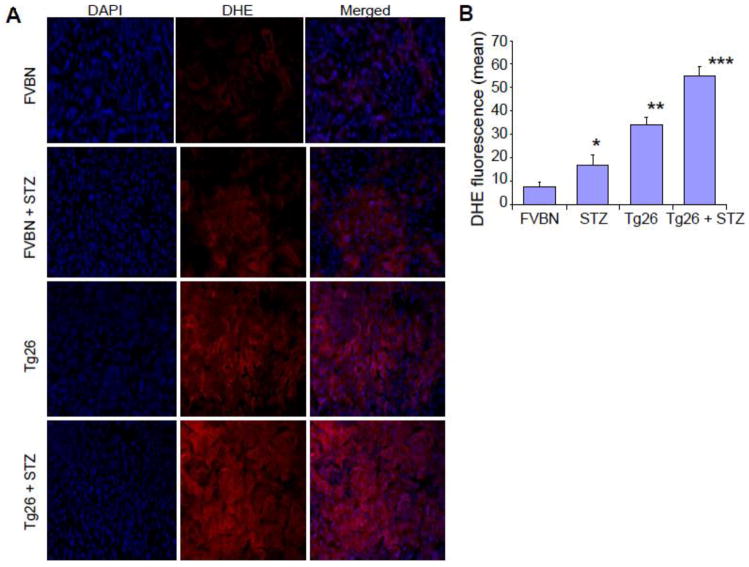
Figure 3. Hyperglycemia enhances ROS generation by kidney cells.
Representative kidney frozen sections of control (FVBN), hyperglycemic FVBN (FVBN + STZ), Tg26, and hyperglycemic Tg26 (Tg26 + STZ) mice were stained with DHE. Nuclei were stained blue with DAPI. ROS generation is displayed by red fluorescence.
B. Cumulative DHE fluorescence data are shown in bar graphs.
*P<0.05 compared to FVBN; **P<0.01 compared to FVBN and STZ;***P<0.01 compared to all other variables.

