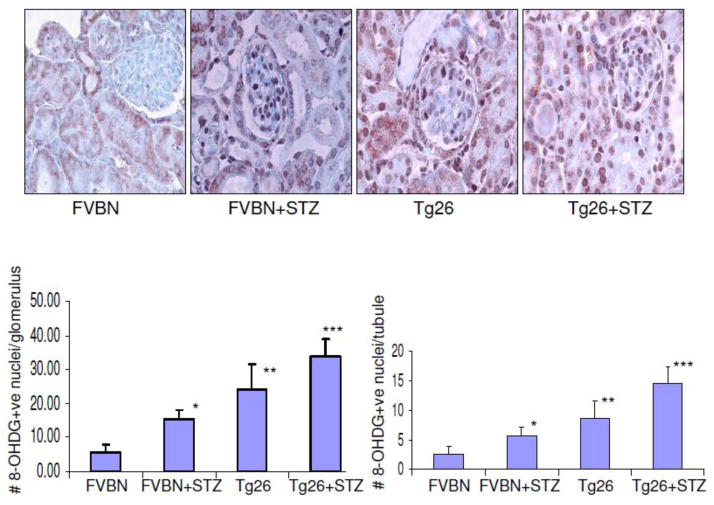
Figure 4. Hyperglycemia enhances oxidative DNA damage in Kidney cells in Tg26 mice.
Renal cortical sections of control mice, hyperglycemic mice, Tg26, and hyperglycemic Tg26 mice were immunolabeled for 8-OHDG expression.
A. Representative microphotographs showing expression of 8-OHdG by kidney cells in different groups. 8-OHdG +ve nuclei are darkly stained.
B. Cumulative data on number of 8-OHDG +ve nuclei per glomerulus. *P<0.01 compared to FVBN; **compared to FVBN and FVBN +STZ.
C. Cumulative data on number of 8-OHdG +ve nuclei/tubule. *P<0.05 compared to FVBN; **P<0.01 compared to FVBN;***P<0.05 compared to Tg26.

