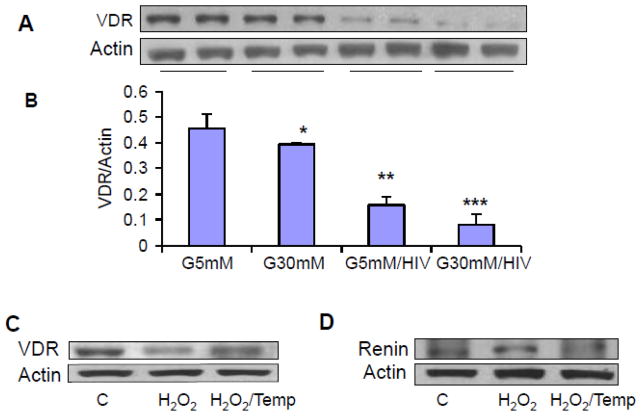
Figure 6. High glucose exacerbates HIV-induced down regulation of VDR in human podocytes.
A. Control and HIV-transduced podocytes were incubated in media containing either normal glucose (5 mM) or high glucose (30 mM) for 48 hours (n=4). Subsequently, cellular lysates were electrophoresed and probed for VDR. The same blots were reprobed for actin. Representative gels from two different lysates are displayed. The upper lane shows podocyte expression of VDR under control, glucose, and HIV-stimulated states.
B. Cumulative data (n=3) are shown in bar graphs.
*P<0.05 compared to NG; **P<0.01 compared to NG; ***P<0.05 compared to C.
C. Human podocytes were incubated in medium containing either buffer (C) of or H2O2 (100 μM) in the presence or absence of Tempol (1 μM) for 6 hours. Subsequently protein blots were probed for VDR. The same blots were reprobed for actin. Representative gels are displayed.
D. Human podocytes were incubated in medium containing either buffer (C) of or H2O2 (100 μM) in the presence or absence of Tempol (1 μM) for 6 hours. Subsequently protein blots were probed for renin. The same blots were reprobed for actin. Representative gels are displayed.

