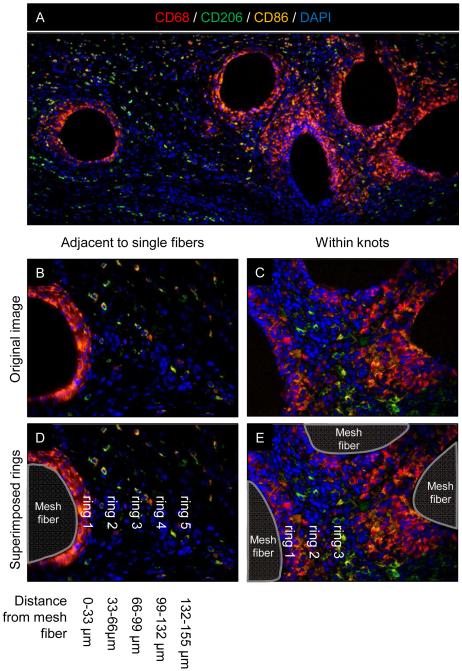
Figure 1.
Histologic mesh imaging and spatial quantification of polarized macrophages. Representative low magnification (100X) immunofluorescent image of an uncoated polypropylene mesh (A) with white boxes indicating the regions of interest for high magnification image acquisition (400X) for macrophage quantification . Images were acquired at the edge of single mesh fibers (B) and within mesh fiber knots (C). The spatial distribution of polarized macrophages relative to the tissue-mesh fiber interface was quantified within the areas of concentric rings (dotted lines) evenly spaced around mesh fibers (D,E). Each ring represents an increased radius of 33 μm from the mesh fiber. Macrophage phenotype was identified via surface markers: CD68+ pan-macrophage (red), CD86+ M1 macrophage (orange), and CD206+ M2 macrophage (green) colocalized with DAPI stained nuclei (blue). Scale bars represent 100 μm.

