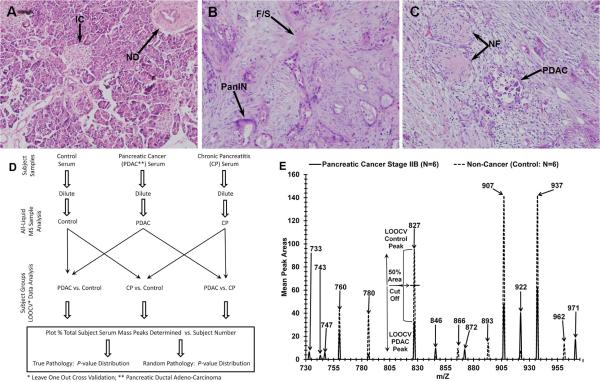
Fig. 1.
Histology of human pancreas tissue and electrospray MS m/Z serum peaks with analysis. Tissues are as follows: Control (Panel A), chronic pancreatitis (B), and (C) stage IIB pancreatic cancer. Hematoxylin and eosin (H&E) staining was performed as described in Materials and Methods. Demarcations and annotations are described in the Results. ESI-MS was performed as described in Materials and Methods. Panel D, flowchart of ESI-MS serum mass profiling. Panel E, electrospray MS methodology used to identify, quantify, and classify significant sera m/Z peaks into pancreatic cancer (PDAC) or non-cancer control descriptors; mass peak areas are averages from 6 individual serum samples per category.

