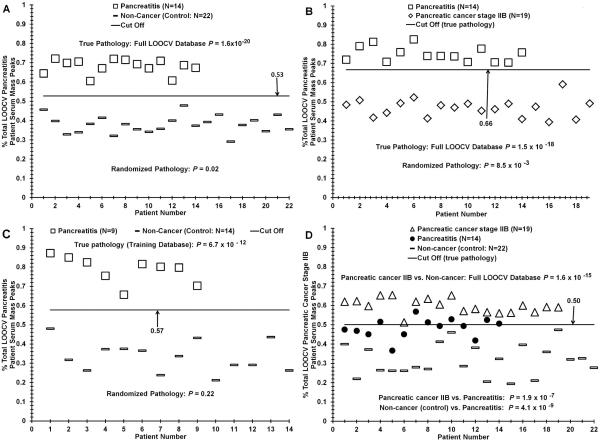
Fig. 3.
ESI-MS analysis discriminating sera from patients with pancreatitis from control individuals and from patients with early-stage PDAC. Panel A, serum sample distribution difference based on “% pancreatitis patient serum peaks” between CP patients and controls using the mass peak analyses described in Fig. 2 legend. Panel B, distinguishing CP patient serum from PDAC stage IIB patient serum. Panel C, distribution analysis of sera from CP patients versus control individuals for the training database used in validation experiments exhibited in Table 3, panel I. Panel D, distinguishing sera from patients with PDAC or CP, and control individuals.

