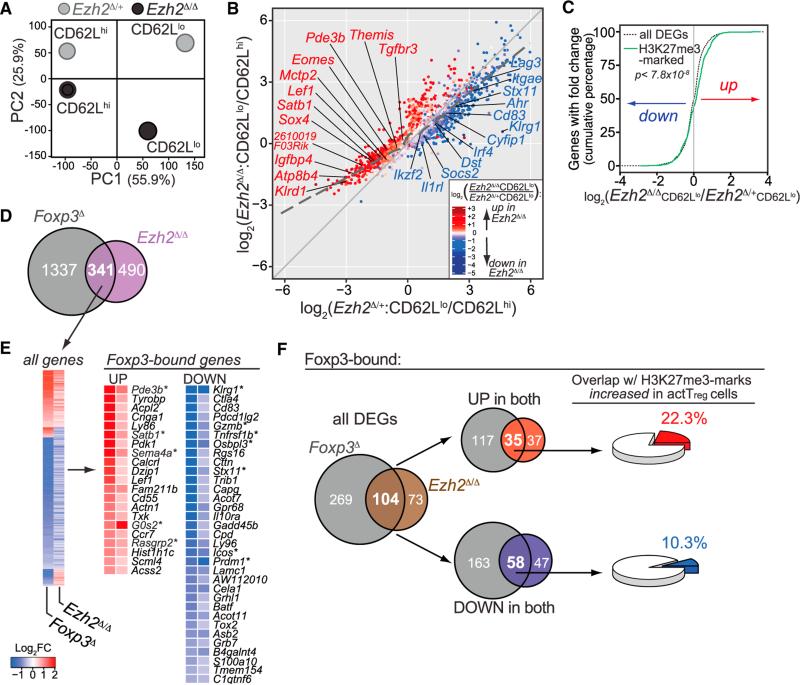
Figure 6. Ezh2 Is Required in Activated Treg Cells to Stabilize the Foxp3-Driven Treg Program.
(A) Principal-component analysis of the transcriptomes of sorted CD62Lhi and CD62Llo YFP+ Treg cells from lymph nodes and spleens of female Foxp3YFP-cre/ Foxp3WT;Ezh2fl/+ (Ezh2Δ/+) and Foxp3YFP-cre/Foxp3WT;Ezh2fl/fl (Ezh2Δ/Δ) mice. The contribution of each principal component to the total variance in the data is shown on each axes (%). Each point represents the combined average of three biological samples except for CD62Lhi Ezh2Δ/+, which is from two samples.
(B) Comparison of all differentially expressed genes (DEGs = 3097, FDR < 0.05) between CD62Lhi and CD62Llo Treg cells in the absence of Ezh2 (Ezh2Δ/Δ, y axis) or presence of Ezh2 (Ezh2Δ/+, x axis). Dashed line represents the trend of all genes differentially regulated between the Ezh2Δ/Δ and Ezh2Δ/+ datasets. Data points are colored by significant differences in gene expression between the CD62Llo populations of Ezh2Δ/Δ versus Ezh2Δ/+ Treg cells: red, increased expression; blue, reduced expression. Differentially expressed “Treg cell signature” genes are labeled and colored with respect to expression change.
(C) Cumulative distribution of fold changes in all DEGs (black dotted line, 3097 genes) or DEGs with increased H3K27me3 marks in activated Treg cells (green line, 465 genes) between CD62Llo Ezh2Δ/Δ and Ezh2Δ/+ Treg cells, p < 7.8 × 10⁻⁸ using the two-sample Kolmogorov-Smirnov (K-S) statistical test.
(D) Venn diagram of DEGs shared between Foxp3D Treg cells (Foxp3gfpkoTreg versus WT Treg: 1,678 genes) and activated Ezh2Δ/Δ Treg cells (CD62Llo Ezh2Δ/Δ versus CD62Llo Ezh2Δ/+ Treg cells: 831 genes).
(E) Clustering of all genes up or down (341 DEGs, FDR < 0.05) between Foxp3D and Ezh2Δ/Δ data sets (left) and expression of Foxp3-bound genes that are up- or downregulated ≥0.5 log2 fold change (right). *, genes also identified by GSEA of Ezh2Δ/Δ Treg cells compared to Treg versus Tconv immunological signatures.
(F) Left to right: Venn diagram depicting Foxp3-bound DEGs in-common between Foxp3D and Ezh2Δ/Δ Treg cells (left); overlap in Foxp3-bound DEGs either up-(top) or downregulated (bottom) in both datasets (middle); percentage of shared up- (top) or downregulated Foxp3-bound DEGs (bottom) in Foxp3D and Ezh2Δ/Δ that are associated with increased H3K27me3 marks in activated versus resting WT Treg cells (right).
See also Figure S5.

