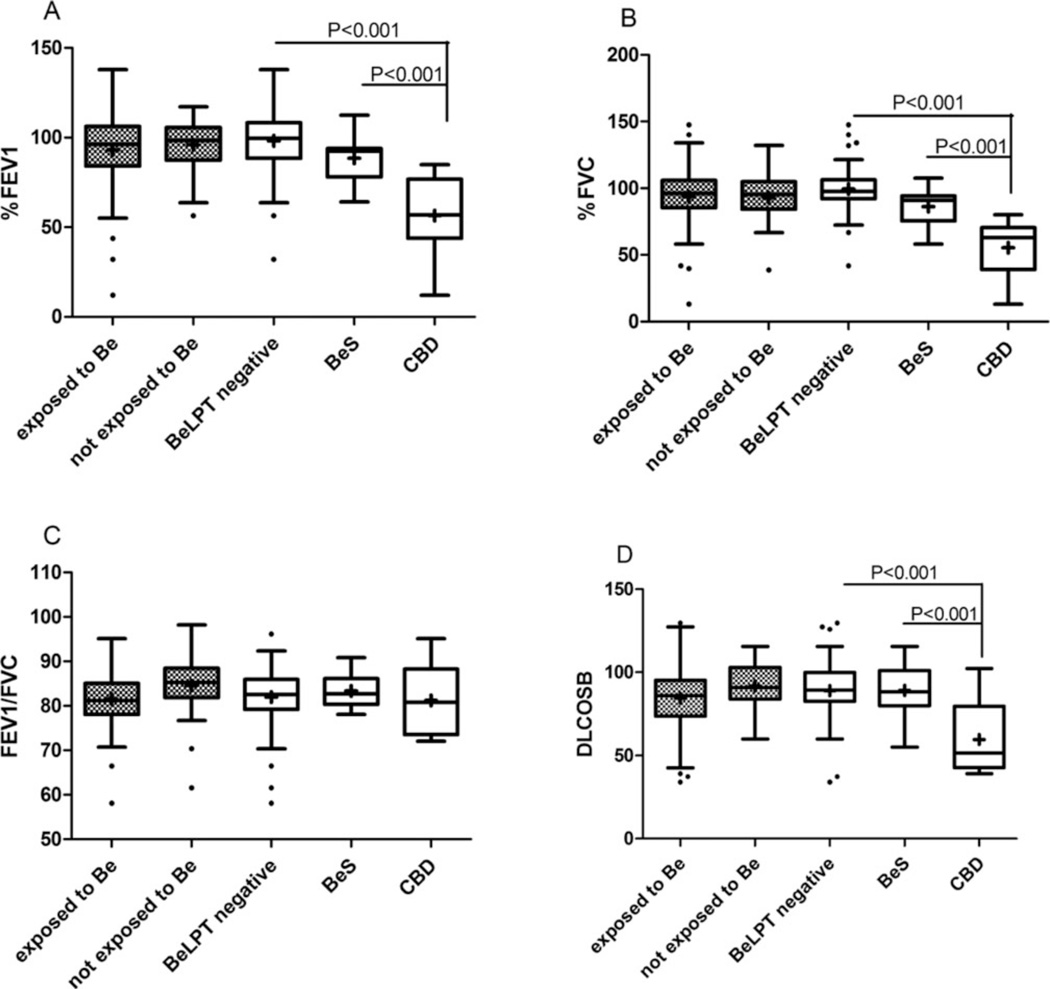
Fig. 2.
Pulmonary function test of study population (N = 83). Box plot diagrams representing medians and interquartile ranges. Gray dots boxes: workers exposed (n = 61) and nonexposed (n = 22) to Be by self-report. White boxes: workers classified by BeLPT result p < 05 was found to be significant using GLM model after logarithmic transformation (negative BeLPT: n = 68; BeS: n = 9; CBD n = 6). (A) FEV1 = forced expiratory volume in 1 second; (B) FVC = forced vital capacity; (C) TLC = total lung capacity; (D): DLcoSB = diffusion capacity of lung CO in a single breath.

