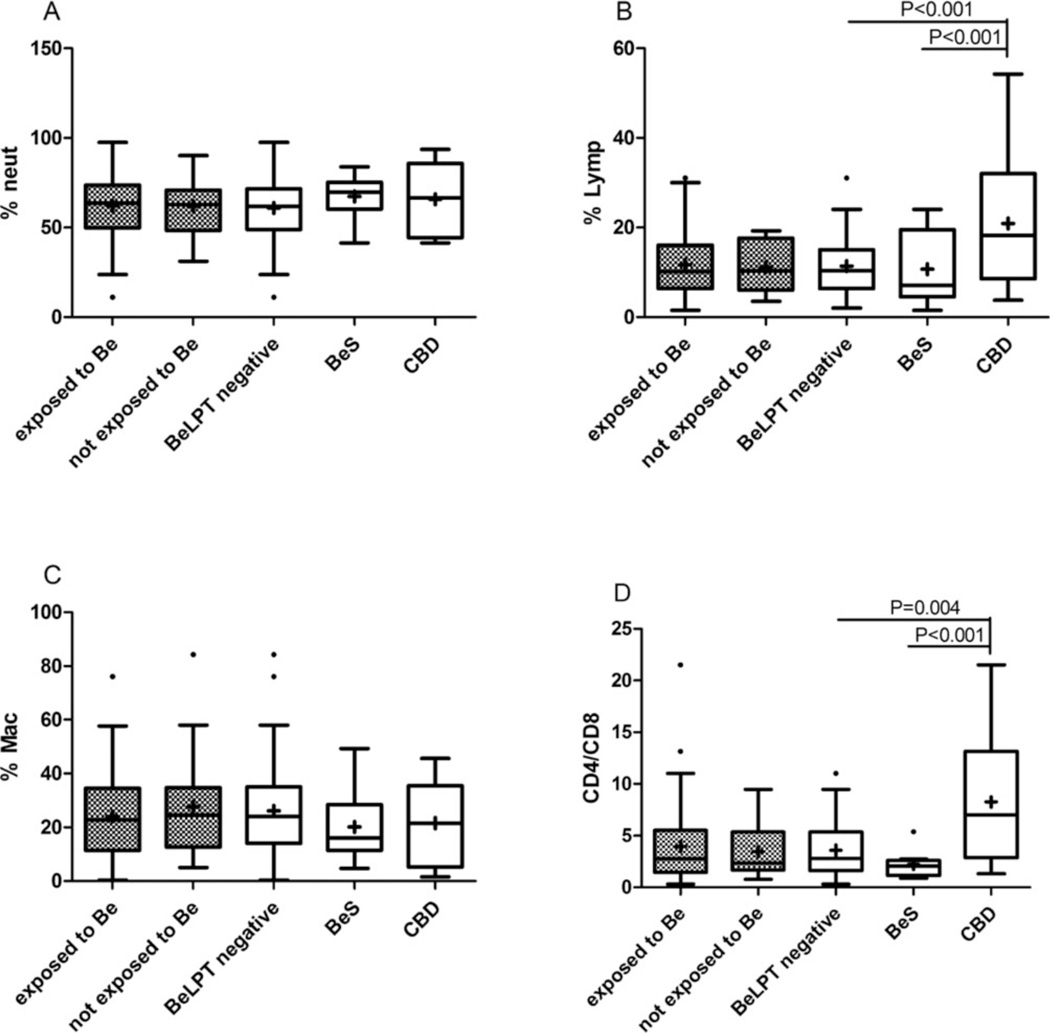
Fig. 3.
Induced sputum (IS) differential cell count (DCC) in the study population (N = 80). (A, B, C) Differential cell counts were performed by counting 400 cells in Giemsa-stained cytopreps. White boxes: workers classified by BeLPT results (negative BeLPT: n = 66; BeS: n = 8; CBD: n = 6). Gray dots boxes: workers exposed (n = 59) and nonexposed (n = 21) to Be by self-report. (D) T-cell subpopulations CD4 and CD8 were done by FACS analysis. White boxes: workers classified by BeLPT result (negative BeLPT: n = 56; BeS: n = 8; CBD: n = 5). Gray dots boxes: workers exposed (n = 52) and nonexposed (n = 17) to Be by self-report p < 05 was considered significant using GLM model after logarithmic transformation. (A) Neut = neutrophils; (B) Lym = lymphocytes; (C) Mac = macrophages; (D) CD4 = helper T cells; CD8 = T cells.

