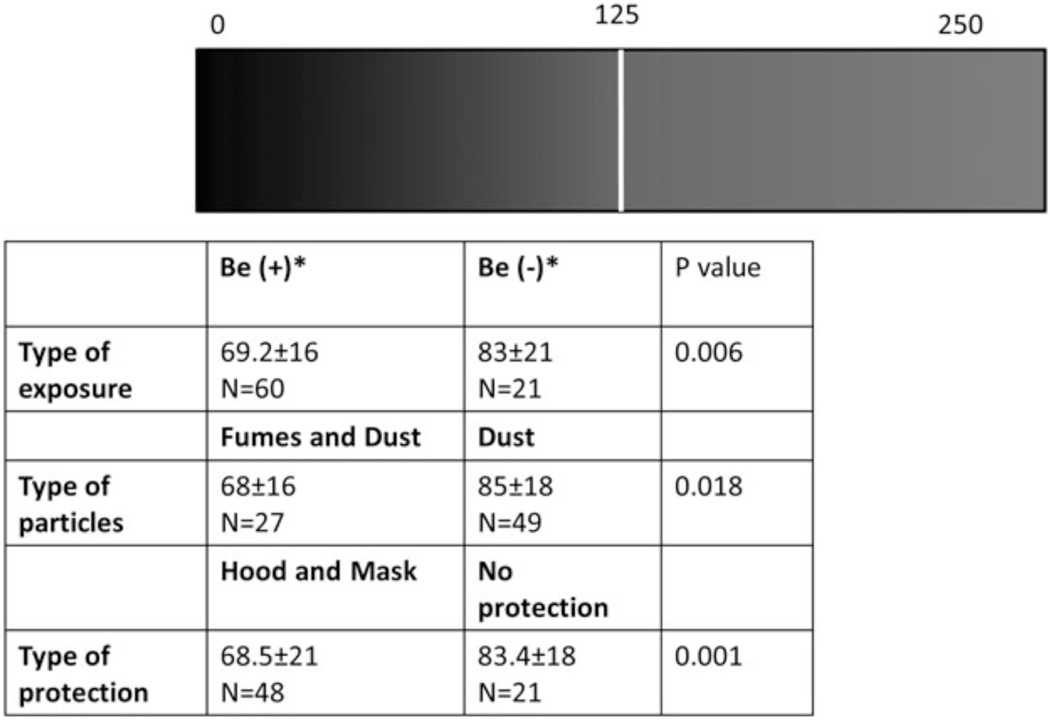
Fig. 4.
Gray level (GL) ranges according type of exposure, particles, and protection. *GL ranges were measured by image analysis as described in Methods. The index ranged from 0 (opaque) to 255 (transparent). The use of protection means was evaluated by self-report and confirmed by an occupational physician p < 05 was found to be significant by ANOVA analysis and multiple comparisons. Fume = produced by condensation of metal vapors; dust = generated by activities.

