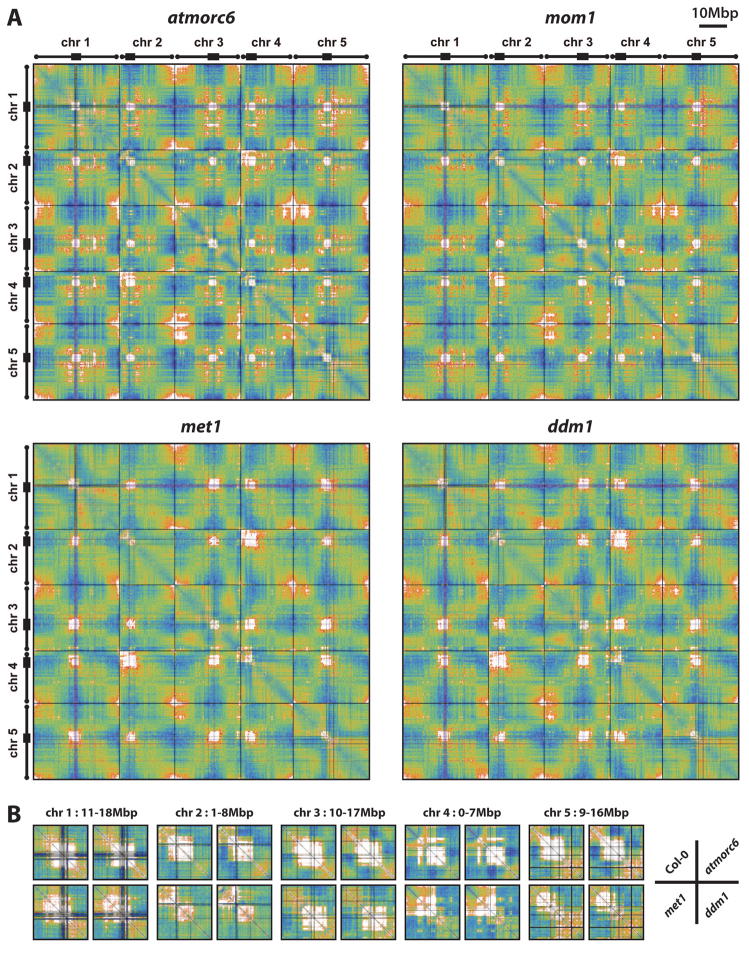
Figure 5. Chromatin interaction patterns in mutants affecting epigenetic processes.
(A) Two dimensional interaction maps of atmorc6, mom1, met1, and ddm1 generated in the same way as Figure 1A.
(B) Detail of selected pericentromeric interactions across wild type and mutants. The region selected for each comparison is indicated on top.
Color scales are the same as in Figure 1A.
See also Figure S5, and Data S2–S5.

