
Figure 6.
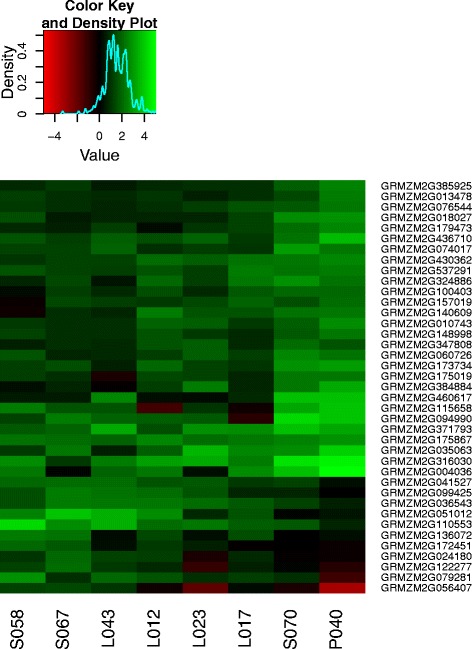
Heat tolerance genes. Differential regulation of the heat tolerance genes, which have been identified with significant (P <0.05) linear association between γ and the heat susceptibility index with a slope of |δ|>2, in eight inbred lines. Colours represent log2 upregulation (green) and downregulation (red) with increasing heat levels.