
Figure 3.
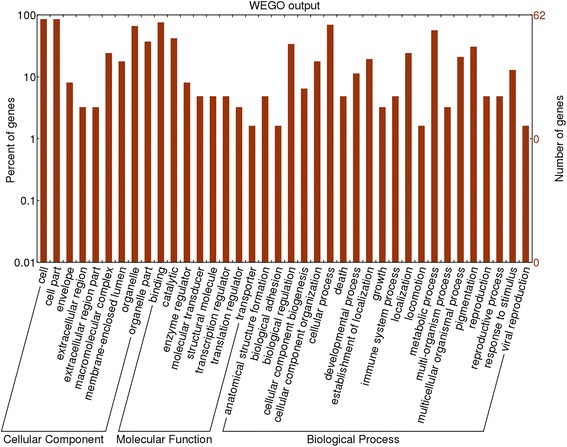
GO distribution analysis of differentially expressed proteins in small intestinal mucosal samples from treatment group and control group. The right coordinate axis indicates the number of proteins for each GO annotation, and the left one represents the proportion of proteins for every GO annotation.