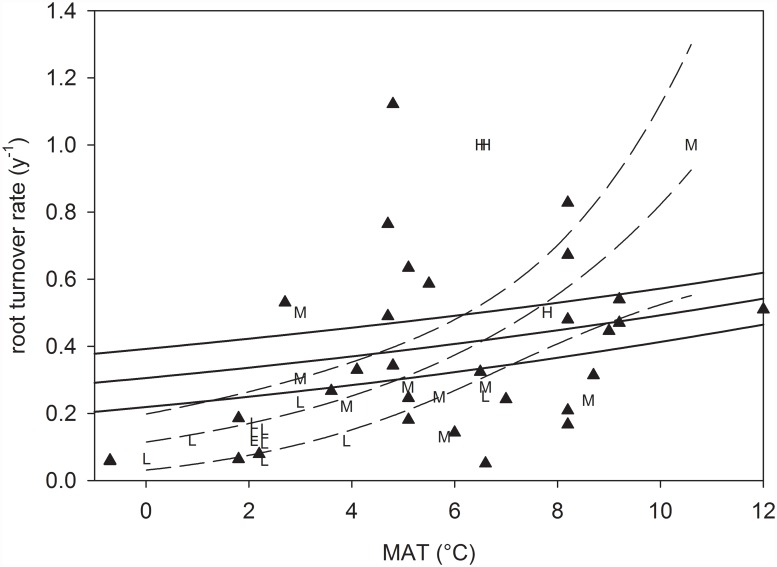
Fig 3. Comparison of root turnover rates (y-1) between the current data set (dashed lines) and the global data set from grassland soils in Gill and Jackson [7] (for explanation, please see text; triangles and solid lines).
Data from the current data set are displayed as letters which refer to the management intensity of the plots (see Table 1). Only the temperature range relevant for this study is shown. Envelopes are 95% confidence intervals of the regression lines.

