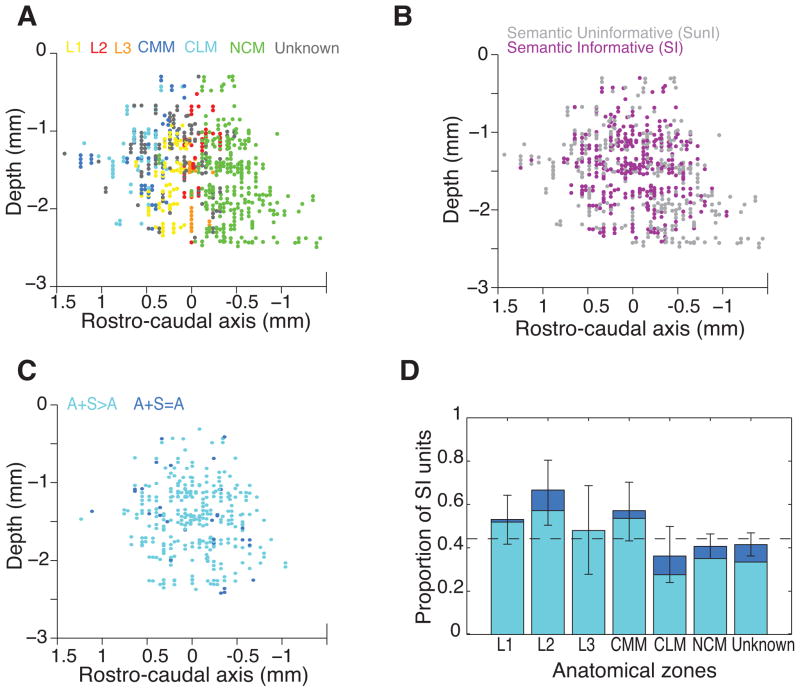
Figure 5. Semantic Informative units location in the avian auditory cortex.
(A), (B) and (C) Left views of a 3D reconstruction of the positions of the single units recorded in the avian auditory cortex. (A) and (B) show 672 out of the 914 units that could be localized on anatomical slices while (C) only represents the 327 Semantic Informative units among the previous ones. The colour code indicates in (A) the auditory structures in which the position of the units could be identified; in (B) Semantic Informative (SI) versus Semantic Uninformative units as defined in Fig 3; in (C) the two populations of SI units that could be distinguished based on the dependence of their Exclusive Categorical Information to Acoustic and/or Semantic disruption as defined in Fig 6. The reference for the depth is the brain surface while it is the peak of the LPS (Lamina pallio-subpallialis) for the rostro-caudal axis. (D) Stacked bar plot of the proportion of the two populations of SI units (as defined in Fig 6) within each cortical auditory structure. Error bars are 95% confidence intervals on the proportion of SI units. Although SI units are found throughout the avian auditory cortex, their proportion is higher in Field L regions and in CMM than in CLM and NCM (Χ25=17.5, p<0.01). The two populations of SI units are approximately evenly distributed between regions (Χ215=10.1, p=0.07). L1, L2 and L3 are the three sub-regions of the avian primary auditory cortex Field L; NCM (Nidopallium caudomediale), CMM (Mesopallium caudomediale) and CLM (Mesopallium caudolaterale) are the sub-regions of the avian secondary auditory cortex; Unknown identify units that could be localized on slices but could not be unambiguously attributed to a particular zone.

