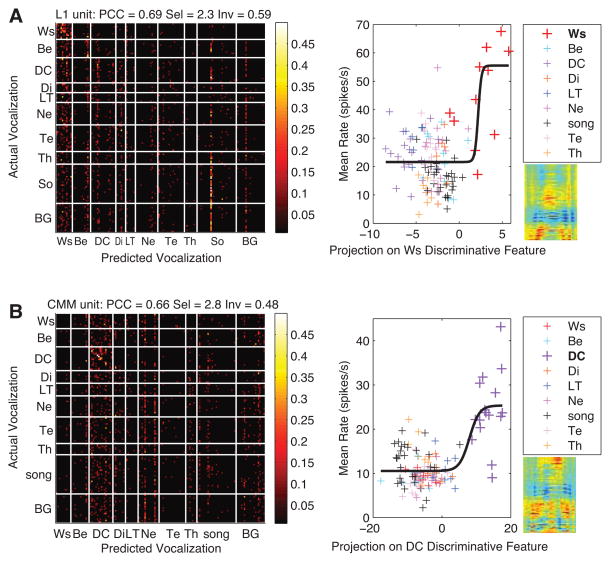
Figure 8. Example of Responses of Selective Units with various level of invariance.
In each row, we show the confusion matrix (left) and a stimulus-response scatter plot (right) for a single unit that is classified as selective (Sel > 1.75) for Wsst calls (A) or Distance calls (B), and that has high level of invariance (A) or low level of invariance (B) for that category. The location, discrimination, selectivity and invariance properties of each unit for Wsst calls (A) or Distance calls (B) are indicated above each confusion matrix. In each row, the confusion matrix shows the conditional probability of decoding the stimulus identity using spike patterns. The stimulus-response curve shows the mean firing rate versus the projection of each stimulus spectrogram onto the acoustical feature dimension that would best discriminate a particular call type from all others. This acoustical feature is obtained in a logistic regression trained to distinguish a particular call type from all others based on spectrograms. Note that this regression is completely independent of the neural responses and was also performed using all sounds in our call database and not just the sounds used in each particular neural recording. The acoustical feature (i.e. also the coefficients of the logistic regression) is shown below the legend and to the right of the x-axis of the scatterplot, in the spectrogram space (x-axis limits 0–200 ms, y-axis limits 0–12 kHz). The acoustical features used for making these stimulus-response curves were obtained in the logistic regressions for Wsst calls (A) and Distance calls (B). The solid black line is the best fit in the minimum mean-square sense of a sigmoid function through the scatterplot. The sparse confusion matrices show that indeed these neurons are most selective for a single semantic category using a decoder that uses both spike counts and patterns. Note that the probability values in the block corresponding to Wsst calls are scattered for the more invariant unit (A) while probability values are concentrated on the diagonal in the block corresponding to Distance calls for the less invariant unit (B). The stimulus-response plots show that the selectivity can also clearly be seen in non-linear spike count responses to the presence of distinctive discriminative acoustical features. Ws: Wsst Call, Be: Begging Call, DC: Distance Call, Di: Distress Call, LT: Long Tonal Call, Ne: Nest Call, So: Song Syllable, Te: Tet Call, Th: Thuk Call.

